RE Price Prediction Today: Rally Targets and Key Support Levels


Something woke this chart up. RE just ripped 29 to 30% in a day, and traders who'd written the coin off are suddenly paying attention again.
Right now $RE trades around $0.478, up sharply on the day, and it's sitting just under a wall of resistance near $0.54 to $0.61. The immediate support is the $0.396 to $0.416 zone, with a harder floor at $0.357, which also happens to be the coin's all-time low from two days ago.
Our base case for this RE price prediction: this is a short squeeze bounce inside a longer downtrend, not yet a trend reversal. If $RE holds above $0.416 on the 4-hour chart, a push toward $0.54 and then $0.61 is realistic. Lose $0.396, though, and the bounce probably fades back toward $0.357. For more setups like this, our crypto price prediction hub tracks similar breakouts across the market.
Why Is RE Coin Suddenly the Center of Attention Today
A number on a screen doesn't jump 30% for no reason. Something changed, and traders noticed before most people even opened the app.
RE has been a quiet, unglamorous project for months, tied to reinsurance and real-world asset yield rather than meme hype. And then, almost overnight, volume exploded, and the price followed. Moves like this tend to ripple through the wider altcoin market outlook too, not just the one coin.
Here's the thing: this isn't the first time this coin has moved this fast. Three weeks ago it did something similar, then gave most of it back.
So is this time different? That's the question every RE holder is asking right now.
RE Coin Overview
Before the charts, here's the snapshot, based on live RE market data:
| Metric | Value |
|---|---|
| Price | $0.4770 |
| 24h Change | +29.72% |
| Market Cap | $76.2M |
| Fully Diluted Valuation | $477.45M |
| 24h Volume | $587.33M |
| Volume / Market Cap | 471.74% |
| Circulating Supply | 159.6M RE |
| Max Supply | 1B RE |
| Holders | 9,920+ |
| All-Time High | $1.09 (Jun 21, 2026) |
| All-Time Low | $0.3576 (Jul 20, 2026) |
| Liquidity / Market Cap | 0.02% |
That volume to market cap ratio is the one to sit with for a second. It's not organic buying. That's leverage, churn, and traders flipping the same coins back and forth many times over.
$RE Technical Chart Analysis: What the Charts Are Actually Showing
Let's get straight into the charts, since that's where the real signal is.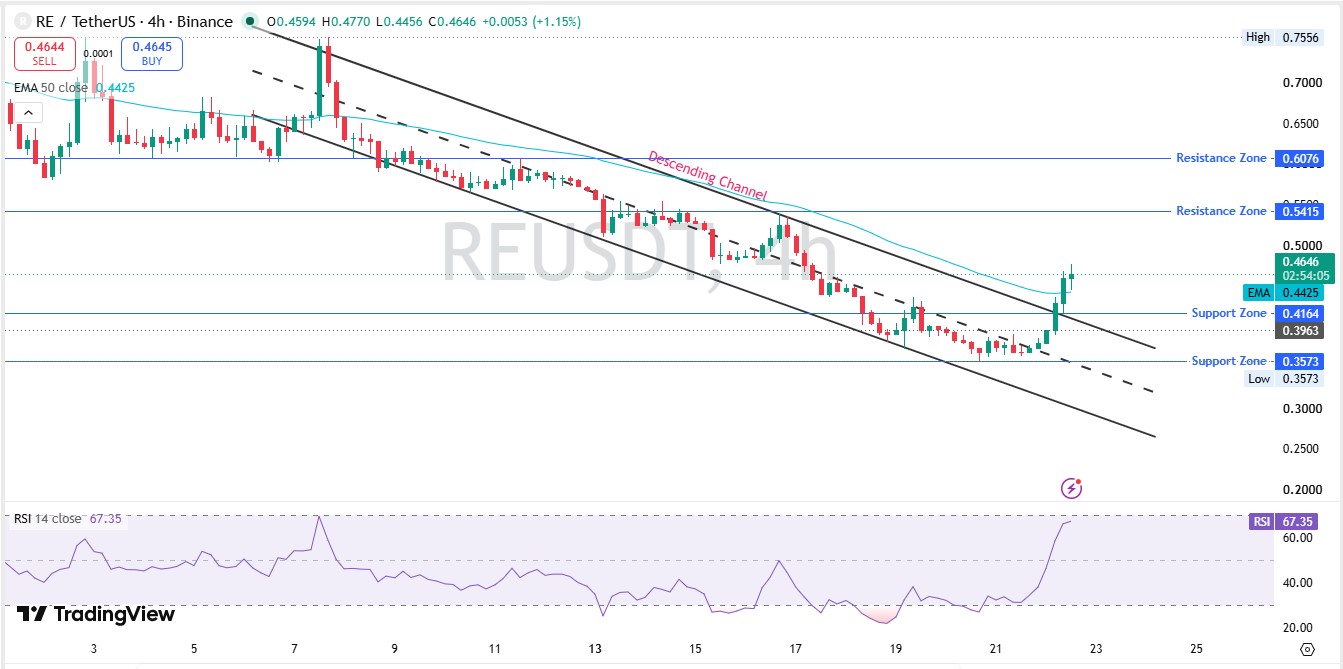
On the 4-hour chart, price broke above the descending channel's upper trendline in the last few hours, and RSI (a momentum gauge that reads overbought above 70 and oversold below 30) sits at 67.35.
Close to overbought, not there yet. The 50 period EMA (a moving average that smooths price to show trend direction) is at $0.4425, and price is now trading above it for the first time in over a week. You can track this setup live on the RE price chart as it develops.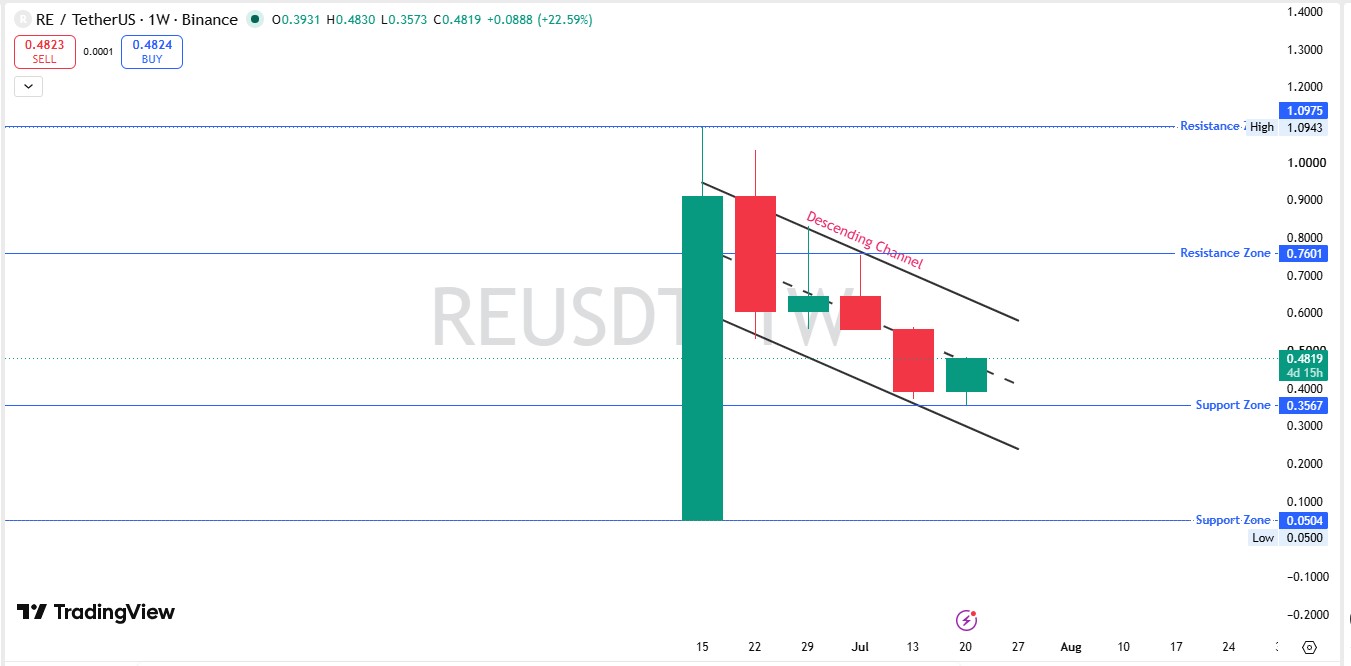
The weekly chart tells the bigger story. $RE printed a massive green candle weeks back, spiking to an all-time high of $1.0975, then rolling into a clean descending channel. Every bounce since has been sold. That channel is still intact.
That's a real technical shift. But one candle doesn't undo a three-week downtrend.
Why RE Is Pumping: The WhiteBIT Listing and the Short Squeeze
Turns out, there's a clear catalyst here, and it's not just chart pattern magic.
WhiteBIT added $RE spot pairs against USDT and USDC, and then followed up with a WhiteBIT futures announcement listing an $RE perpetual contract with leverage up to 100x. New exchange listings routinely cause this kind of move, and it's a pattern we cover often across crypto exchange listings. More venues, more access, more speculative capital chasing the same float.
And the timing lines up with a brutal squeeze on short sellers. RE liquidation data shows $432.62K wiped out in 24 hours, with $305.00K of that coming from short positions and only $127.61K from longs. Traders betting against $RE got run over.
That explains the speed of the move. It doesn't necessarily explain what happens next.
Futures volume is also doing most of the heavy lifting here, not spot demand. Binance alone shows $96.95M in futures volume; OKX, another $84.00M; with Bybit, Bitget, KuCoin, MEXC, and others adding tens of millions more. Spot demand from real holders is a much smaller slice of this than the headline volume suggests, and it doesn't line up with any broader crypto market rally; this move looks isolated to $RE. The project's own Re protocol updates have leaned into new DeFi integrations lately too, which hasn't hurt sentiment.
The Whale Concentration Problem Nobody's Pricing In
Here's the part that should slow down anyone thinking about chasing this rally.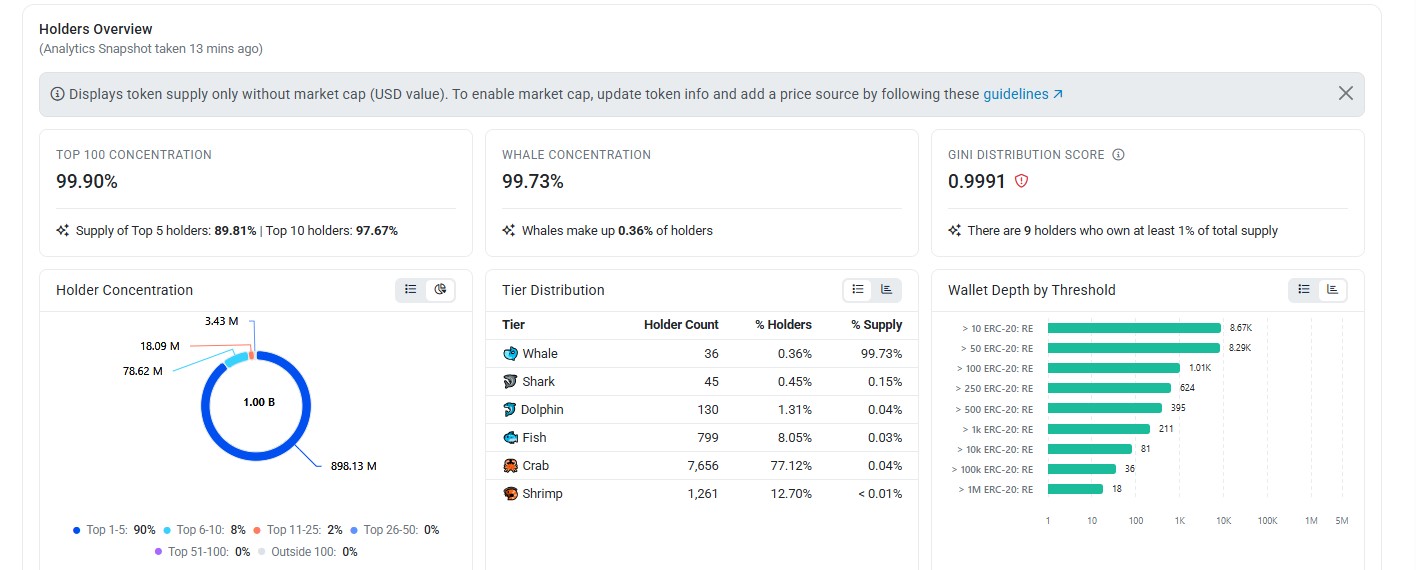
RE's token holder distribution is about as concentrated as it gets. The top 5 wallets control 89.81% of total supply. The top 10 hold 97.67%. Whale wallets, just 0.36% of all holders, control 99.73% of supply. The Gini distribution score, a measure of inequality where 1.0 means total concentration, sits at 0.9991.
The single largest holder isn't even a person or fund. It's Hedgey Finance's bound lockup contract, holding 34.04% of supply. That's tokens under vesting, and vesting schedules eventually unlock. When they do, that supply becomes sellable, so it's worth keeping an eye on any crypto token unlock calendar for RE's next scheduled release.
Liquidity is also thin relative to size. Liquidity to market cap sits at just 0.02%, which means large orders can move this price a lot in either direction.
None of this means RE can't keep climbing short-term. But it does mean the float that's actually free to trade is small, and a handful of wallets can dictate where this goes.
What Could Push RE Higher From Here
If buyers keep control, here's the logical path up.
Target one: $0.5415. This is the first major 4-hour resistance zone. Reclaiming and holding above the $0.4425 EMA is the trigger. Invalidation for this target: a 4-hour close back below $0.4425, which would suggest the breakout was a fakeout.
Target two: $0.6076. The next resistance band is on the 4-hour chart and roughly the midpoint of the broader weekly range. This needs sustained volume, not just a squeeze spike, to be credible. Invalidation for this target: failure to close above $0.5415 within a few sessions or a drop back under $0.416 support.
Target three: $0.7601. The weekly resistance zone is a level RE hasn't traded near in weeks. Reaching this would need fresh spot demand joining the futures-driven move, not just short covering. Invalidation for this target: RSI rejecting from overbought territory above 75 without a higher low forming first, which would point to exhaustion rather than continuation.
What Could Send RE Back Down
And here's the other side, because it deserves equal weight.
If $RE loses the $0.4164 to $0.3963 support band on the 4-hour chart, the next stop is $0.3573, the recent all-time low and the weekly chart's major support zone. A break of $0.3573 with volume would put the coin back in fresh low territory, opening a path toward the deeper $0.0504 structural zone from the weekly chart, though that would require a much larger breakdown than what's on the table right now.
Watch funding rates too (the periodic payment between long and short traders on perpetual futures, which turns positive when longs dominate and pay shorts). If funding flips sharply positive while price stalls, that's often a sign the rally is running on leverage rather than conviction, and a flush becomes more likely. It's a similar dynamic to what shows up in the ethereum price outlook whenever leverage runs ahead of spot demand.
RE Price Prediction: Our Take
We'll say it plainly. This looks like a short squeeze and listing pump layered on top of a downtrend, not a confirmed reversal.
The break above the descending channel and the EMA is genuine and worth respecting. But volume this disconnected from market cap, whale concentration this extreme, and a rally built mostly on futures leverage rather than spot accumulation are a fragile combination.
Base case: choppy upside toward $0.54 to $0.61 if $0.416 holds, with real risk of a fast reversal if it doesn't. We wouldn't call this a clean buy signal. We'd call it a bounce to watch, not chase blindly.
Worth remembering that altcoins like $RE often take cues from the majors too, so it doesn't hurt to check where the bitcoin price outlook stands before sizing any trade around this one.
Disclaimer: This article is for informational purposes only and is not financial advice. RE, like most low market cap tokens, carries high volatility and concentration risk. Always do your own research before trading.
Also read:
















