Can XRP Hit $1.20 First? Ripple XRP Forecast 2026 and $120 Outlook

Updated: July 20, 2026
Latest Update: Added ETF outlook, breakout confirmation checklist, analyst comparison, support & resistance levels, and revised XRP forecast.
Can XRP hit $1.20 before aiming for much bigger targets like $120? That is the question dominating XRP traders this week.
The token is trading around $1.18 while a short-term triangle breakout and a long-term macro pattern are attracting fresh attention.
This article examines whether XRP can hit $1.20, today's XRP analysis, ETF developments, trading volume, moving averages, and the technical conditions required before larger price projections become realistic.
Readers can also explore our detailed XRP price prediction 2026 for a broader long-term outlook.
Can XRP Hit $1.20? XRP Analysis Today
On the 1-hour graph, the altcoin is trading near $1.183. A trader known as Ali Charts pointed out a symmetrical triangle forming on the short-term graph.
A symmetrical triangle happens when the price moves in smaller and smaller swings. Eventually, the price breaks out one way or another.
According to the graph shared, a breakout from this pattern could lead to a move of around 14%. That move could go up or down, depending on which way the price breaks.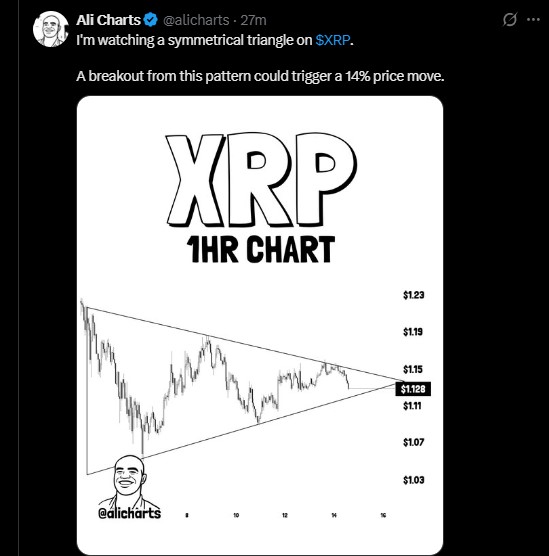
For the bullish setup to remain valid, $XRP must close above $1.20 with increasing trading volume. A daily close above this level followed by a move through $1.25 would confirm buyers are gaining control.
Failure to hold $1.15 would invalidate the short-term breakout and increase the probability of another retest toward lower support.
What Indicators Support the $XRP Forecast?
The current outlook combines several technical indicators rather than relying on a single chart pattern. Traders are watching:
RSI for momentum recovery
50 EMA and 100 EMA for trend direction
Fibonacci extensions for long-term targets
Trading volume for breakout confirmation
On-chain activity and ETF-related capital flows for institutional demand.
No single indicator predicts price movement on its own, but together they help build a probability-based outlook.
Why are people talking about $XRP and ETFs?
Another post making the rounds claims Wall Street interest in $XRP is growing. It points to a T. Rowe Price Active Crypto ETF filing with the SEC, suggesting an 11.42% allocation tied to $XRP.
ETF filings can be a sign that bigger financial firms are paying attention to an asset. However, filings alone do not guarantee approval or that the fund will actually launch.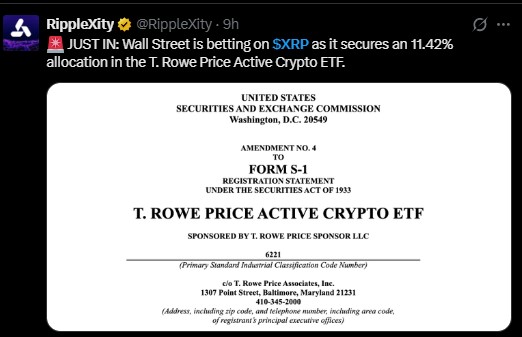
Recent $XRP ETF flows continue to attract attention because institutional demand has become one of the biggest narratives driving Ripple.
Although ETF applications and inflows alone cannot guarantee higher prices, sustained institutional buying has historically supported stronger market sentiment during previous crypto cycles.
Institutional participation has become one of the biggest drivers behind the XRP forecast in 2026.
ETF applications, growing institutional exposure, and improving regulatory clarity continue attracting investor attention.
Although ETF approvals do not guarantee immediate price appreciation, sustained institutional inflows have historically supported stronger long-term market sentiment.
XRP Price Prediction Today: What Does the Long-Term Triangle Show?
This is where the bigger story comes in. A long-term chart from EGRAG Crypto shows altcoin forming a massive symmetrical triangle stretching back to 2017.
This triangle compresses years of price action into a tighter and tighter range. The chart highlights the 50 EMA, 100 EMA, and the 144-week moving average as key levels to watch.
The analysis marks January 2026 as an important time window. According to the chart, it could be near the tip of this long-term triangle, often a point where big moves happen.
What are the price targets shown on the chart?
The graph lists several Fibonacci extension levels as potential targets. These include 1.272 (around $9.27), 1.414 (around $15.37), and 1.618 (around $31.76).
At the very top of the chart, there is a marker near $120, tied to a much larger percentage move of over 2,600%. This is shown as a long-term, multi-year possibility, not a short-term target.
These are not promises. They are simply levels drawn from technical analysis tools that traders use to guess where the price might go if a trend continues.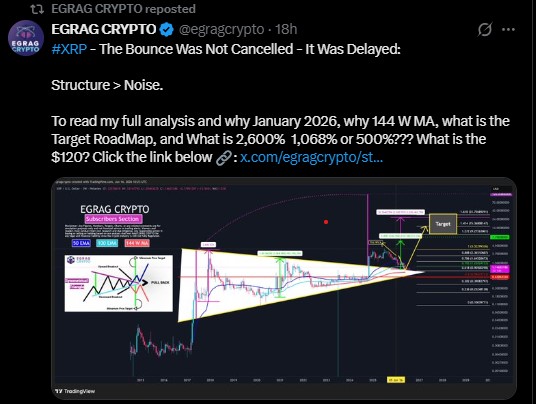
These are not promises. They are simply levels drawn from technical analysis tools that traders use to guess where the price might go if a trend continues.
Other analysts remain more conservative. Standard Chartered has previously outlined a base-case target around $2.80, while EGRAG Crypto continues to project a broader $7-$10 cycle range if macro momentum returns.
The current $120 projection represents the most optimistic technical extension and should be viewed separately from these lower probability scenarios.
Other analysts remain more conservative.
· Standard Chartered has outlined a base-case target around $2.80.
· EGRAG Crypto continues projecting a broader $7–10 cycle range.
· The current $120 projection represents the most optimistic technical extension and should be viewed separately from these lower-probability scenarios.
XRP Support and Resistance Levels
Support | Resistance |
$1.15 | $1.20 |
$1.08 | $1.35 |
$1.00 | $2.00 |
Readers looking for a deeper technical breakdown can also explore our detailed XRP support and resistance levels analysis.
What is the "second chance" narrative about XRP?
A separate post argues that the altcoin is still trading near levels seen back in 2018. The chart shows price moving sideways inside a long-term range, with a "Resistance Zone" marked higher up.
The idea here is that people who missed buying this altcoin years ago are getting another shot at similar prices. The chart also shows an upward arrow suggesting a possible future breakout above the marked resistance zone.
Again, this is one trader's view based on historical price patterns, not a guarantee of future performance.
Bull, Base and Bear Scenarios
Scenario | Target | Probability | Invalidation |
Bull | $2.80-$7 | Medium | Below $1.00 |
Base | $1.35-$2 | High | Below $1.08 |
Bear | $0.85 | Medium | Loss of macro support |
This scenario analysis combines RSI, moving averages, ETF demand, macro sentiment, trading volume, and historical price structure instead of relying on a single indicator.
Can $XRP Hit $1.20 Before Targeting $120?
$XRP first needs to confirm a breakout above $1.20 before traders can realistically target higher levels. Rising trading volume, stronger XRP RSI, improving ETF demand, and reclaiming key moving averages would strengthen the bullish case.
Short-term targets around $1.35 and $2.00 appear more achievable, while larger projections such as $9, $15, or even $120 remain highly speculative and depend on sustained institutional adoption, favorable macroeconomic conditions, and multiple bullish market cycles.
For investors wondering if it will go up tomorrow, if it is a good buy right now, or whether it is bullish or bearish, the most important signals remain price confirmation, trading volume, and institutional participation rather than headline price targets.
Disclaimer
This article is for informational purposes only and does not constitute financial advice. Cryptocurrency markets are highly volatile and risky. Always do your own research and consult a licensed financial advisor before making any investment decisions.











.jpg)






