Rollblock Price Prediction: Hidden Secret Behind RBLK Chart? Must See!


By Crypto Markets Analyst. Reviewed by the Crypto Markets Editor. Data captured from the live RBLK price dashboard, August 6, 2026.
The Rollblock price prediction conversation usually centers on price alone, but RBLK's chart is hiding a more telling detail in its volume data.
At $0.00141, down 2.70% today, RBLK trades 96% below its 52-week high of $0.0365 while still sitting well above its 52-week low of $0.00108.
That gap, combined with just $596.61 in daily volume against a $1.4M FDV, is the real signal worth examining before reading too much into the price chart alone.
RBLK Market Snapshot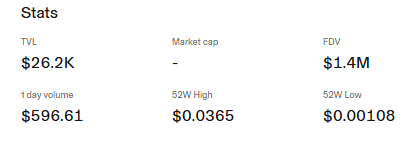
Source: Rollblock Info by Uniswap
The Hidden Signal: Volume, Not Price
Most chart reads on RBLK focus on the visible price swing, a sharp early drop followed by a climb into late July, then a plateau through early August.
But the number that actually explains current conditions is volume: $596.61 in a single day against $26.2K in TVL and a $1.4M FDV.
That's a market where very little capital is moving relative to the token's total valuation, meaning today's 2.70% decline happened on thin trading rather than heavy selling.
This distinction matters directly for RBLK support and resistance levels, since with volume this low, any technical level identified on the chart carries less weight until trading activity picks up.
What the Chart Pattern Actually Shows
The 1D chart shows an initial sharp downward wick, a steady climb through the following session that roughly doubled off the early low, then a multi-day consolidation phase holding in a tight $0.00138-$0.00146 range before the current pullback to $0.00141. 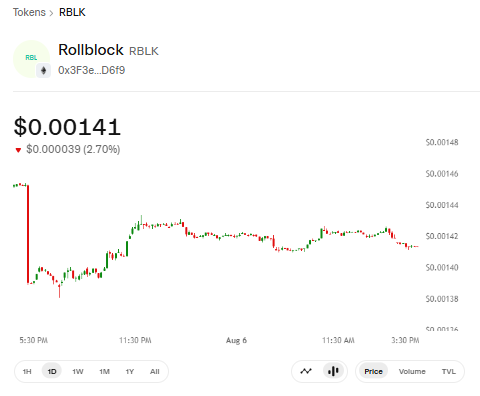
Source: RBLK Trading Chart by Uniswap
That consolidation phase, where the price holds a narrow range for an extended period, typically reflects a market waiting for a catalyst rather than one with active directional conviction in either direction.
Rollblock Price Prediction: Downside Scenario
If thin volume continues and selling pressure persists, RBLK has considerable room before testing its 52-week low of $0.00108, since no closer support level is marked on the available chart.
A move toward that zone would need to happen on notably higher-volume than the current $596.61 to be considered a meaningful trend rather than low-liquidity drift.
Invalidation: This path is invalidated by a sustained-volume increase alongside a price hold above $0.00141 for more than one session.
Rollblock Price Prediction: Upside Scenario
If volume-increases and the recent consolidation range breaks upward, the next reasonable reference point sits well below the 52-week high of $0.0365, that gap is wide enough that near-term upside targets should be treated cautiously rather than extrapolated directly from the yearly high.
A confirmed volume-increase alongside a break above the recent $0.00146 consolidation ceiling would be the clearer signal of renewed buying interest.
Invalidation: This upside path is invalidated by a failed hold above $0.00141 or continued sub-$600 daily volume.
Risks Worth Naming Directly
The clearest risk is liquidity: $596.61 in daily-volume against a $1.4M FDV means RBLK is thinly traded, and price moves in either direction should be read with that context rather than as strong directional signals.
Market cap is currently unavailable on the dashboard, which limits full valuation comparison until circulating supply is disclosed.
The 96% distance from the 52-week high reflects a significant prior drawdown that has not reversed, and no confirmed catalyst is currently driving volume higher.
Glossary
-
TVL (Total Value Locked): The dollar value of assets currently deposited in a project's protocol or liquidity pool; RBLK's is $26.2K.
-
FDV (Fully Diluted Valuation): A token's theoretical market cap if its entire max supply were in circulation at the current price.
-
Consolidation Range: A period where price trades within a narrow band, often reflecting low conviction or a market awaiting a catalyst.
Disclaimer
Informational purposes only, not financial advice. Price scenarios above are based on available chart and dashboard data only; no drawn technical levels were provided in the source. RBLK trades in a low-liquidity environment. Verify all data independently before making any decisions.


















