Shiba Inu Price Prediction: Why Traders Expect a Massive $SHIB Move


Shiba Inu launched back in 2020 as a self-described "Dogecoin killer," and despite the meme origins, it's stuck around long enough to build out its own ecosystem, including the Shibarium layer-2 network.
Whether that history means much for near-term price is a fair question, but the token has clearly outlasted most of the memecoins that launched around the same time.
Right now, $SHIB is trading at $0.00000474, down slightly on the day and sitting well below its all-time highs from years back.
This shiba inu price prediction looks at where that price could be headed next, based on recent market behavior rather than the coin's origin story.
Live Market Data
$SHIB is currently trading at $0.00000474, down today 3.1% over the past 24 hours after ranging between $0.00000471 and $0.00000493. 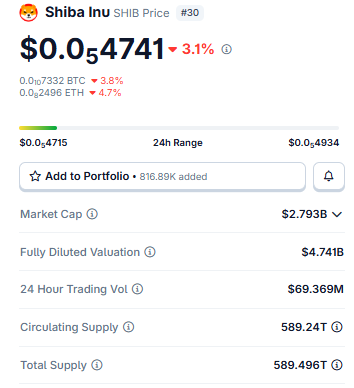
Source: $SHIB Market Cap Data Taken From Coingecko, data as of Aug 06, 2026. Figures may vary slightly across other tracking websites.
Market cap comes in at $2.793B against a fully diluted valuation of $4.741B.
Trading volume over the past day reached $69.369M, with circulating supply at 589.24T SHIB out of a 589.496T total supply.
Liquidation Heatmap
The liquidation heatmap leans heavily toward longs getting caught out here.
Just in the past hour, $92.25K in longs got liquidated against a mere $10.84K in shorts, $103.09K total. The 4-hour window looks nearly identical at $103.11K. 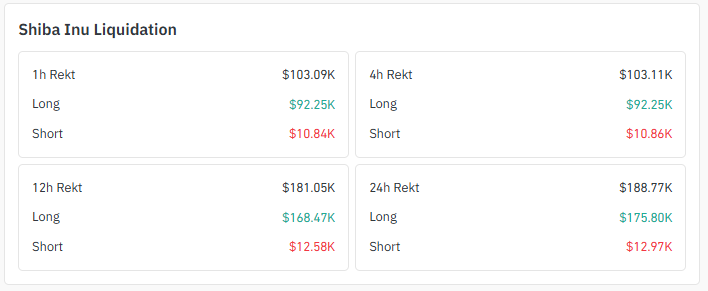
Source: Liquidation Data Taken From Coinglass.
Stretch that further to 12 hours, and total liquidations climb to $181.05K, with longs eating $168.47K of it.
Over the full 24 hours it's $188.77K total, with longs again dominating at $175.80K against $12.97K in shorts.
This pattern lines up with today's 3.1% drop pretty cleanly; leveraged buyers keep getting caught wrong-footed as price grinds lower.
Exchange Volume
Exchange volume for SHIB spot trading is fairly spread out this time. 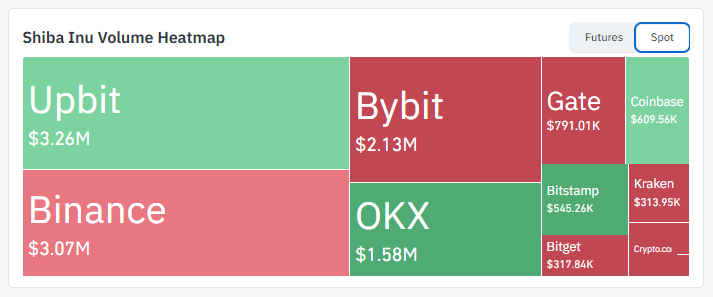
Source: Volume Heatmap Data Taken From Coinglass.
Upbit edges ahead at $3.26M, just barely past Binance at $3.07M. Bybit follows at $2.13M, then OKX at $1.58M. Gate, Coinbase, Bitstamp, Kraken, and Bitget make up the rest, none crossing $800K on their own.
Unlike tokens where one exchange dominates trading, this more even spread suggests $SHIB activity isn't concentrated in any single venue right now.
Social Sentiment of $SHIB
Here's the standout news this week: Shiba Inu is now usable at Dubai Duty Free airport stores through Crypto.com Pay, letting customers pay with SHIB and 29 other cryptocurrencies at DXB and DWC locations, with payments instantly converted to UAE dirhams. 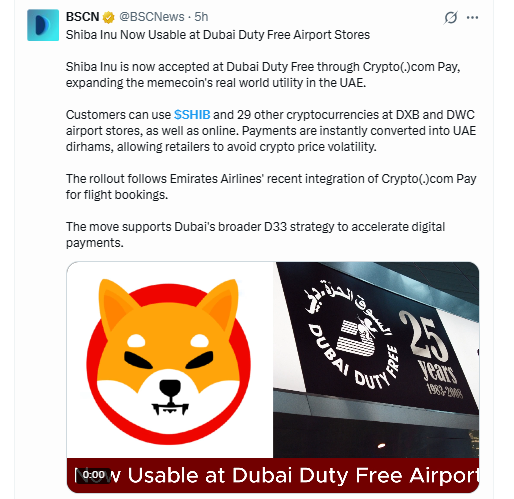
Source: Data Taken From @BSCNews, X Account.
It follows Emirates Airlines' own recent Crypto.com Pay integration for flight bookings, and it ties into Dubai's broader D33 strategy to push digital payments forward.
Stories like this rarely move price overnight, but they build a longer-term case for this shiba inu price prediction that goes beyond pure speculation.
Key Takeaways
Down 3.1% today and sitting at $0.00000474, that's SHIB right now, having just slipped through its 1H channel support
Hold the support zone and this shiba inu price prediction points toward $0.00000494, maybe $0.00000517 if buyers keep showing up
Longs are the ones bleeding, with $175.80K liquidated over 24 hours against a mere $12.97K on the short side
Worth watching: a Wolfe Wave setup on the daily chart is flashing a potential upside signal if the falling trendline breaks
Shiba Inu just went live at Dubai Duty Free airport stores, a real-world payments push that's easy to overlook but worth noting
Technical Analysis
Hourly Chart Analysis $SHIB
Start with the hourly chart, where any solid Shiba Inu price prediction has to begin right now.
$SHIB has been sliding inside a descending channel, and the price just poked through the lower boundary. 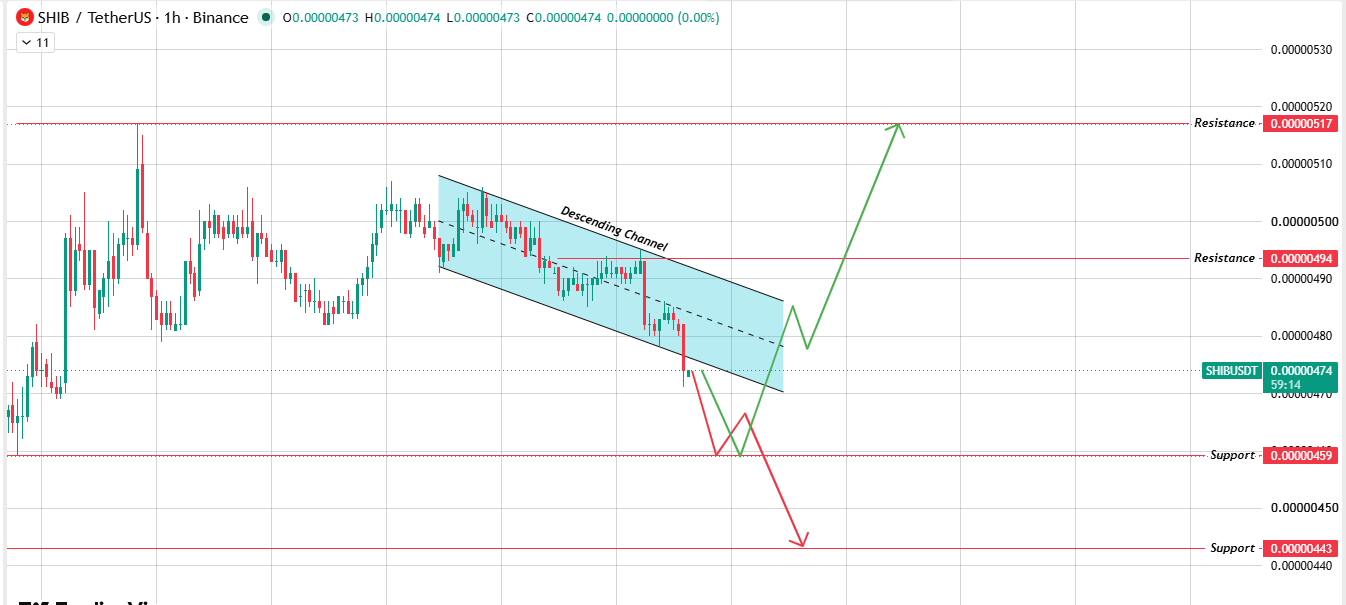
Source: Chart Taken From TradingView.
Whether this holds matters a lot. If it's real, the next stop is $0.00000459, with $0.00000443 waiting deeper if selling keeps up.
But there's another read worth considering: a liquidity sweep, where price briefly dips below support just to trigger stop losses before snapping back inside the channel.
If that's what's happening, a bounce could carry the price back toward $0.00000494, then $0.00000517.
Daily Chart Analysis of $SHIB
Zoom out to the daily, and the story gets more layered. SHIB is testing support along a falling trendline that's capped the price for a while now. 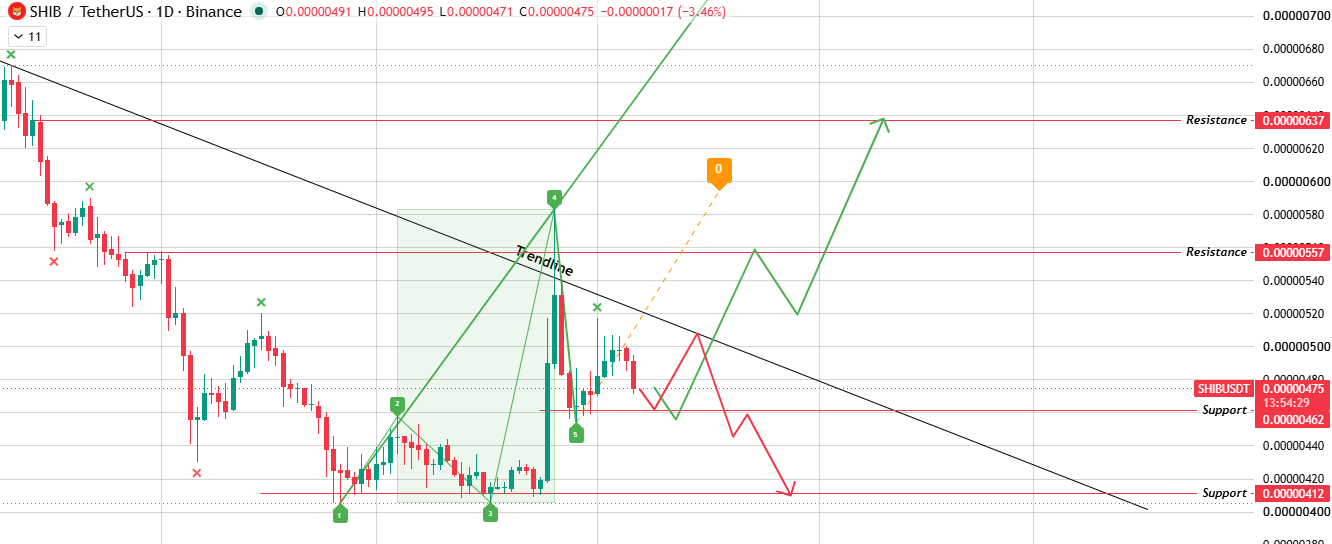
Source: Chart Taken From TradingView.
Buyers showing up here with real volume, breaking that trendline in the process, would open a path toward $0.00000557, then $0.00000637.
There's also a Wolfe Wave pattern on this chart, a five-point structure that often flags an approaching reversal, and it's leaning the same direction, toward upside.
Get rejected at the trendline again, though, and price likely heads back down toward $0.00000462, with $0.00000412 waiting below that.
Bull, Base, and Bear Cases
Three ways this could play out.
The bull case needs a bullish breakout above the descending trendline with real volume behind it, which would put $0.00000557 in range, then $0.00000637 further out, and this scenario looks moderately likely right now.
The base case is simpler: price just chops between $0.00000459 and $0.00000494 without committing either way, and that's honestly the more probable outcome in the near term.
The bear case kicks in on a confirmed bearish breakdown below the $0.00000459 support zone, opening the door to $0.00000443 and potentially $0.00000412 below that, also a moderate possibility given current momentum.
Invalidation: the bull case fails if SHIB gets rejected at the daily trendline without follow-through buying. The bear case is invalidated if the price sweeps below support and snaps back quickly, which would suggest a liquidity grab rather than a genuine breakdown.
Risks
A few things could throw off this shiba inu price prediction.
That heavy long liquidation bias suggests leveraged buyers keep getting caught on the wrong side, and it could keep happening if this channel breakdown turns out to be real.
BTC dominance trends matter here too; SHIB tends to underperform whenever capital rotates back toward Bitcoin.
And the Dubai payments news, genuine utility win as it is, hasn't yet translated into any meaningful price support.
Glossary
Descending Channel: Picture two trendlines sliding downward side by side. Price bounces between them until it finally breaks free one way or the other.
Wolfe Wave: Five swing points, one pattern. When the final swing wraps up, it's often a heads-up that a reversal is coming.
Support Zone: Basically a floor. An area where buyers have shown up before and might again if the price gets there.
Liquidation Heatmap: Shows where leveraged positions got force-closed and how much money vanished when it happened.
BTC Dominance: Bitcoin's cut of the total crypto market. A rough way to tell whether money's flowing toward altcoins or pulling back into BTC.
Disclaimer: This article is for informational purposes only and does not constitute financial advice. Cryptocurrency markets are highly volatile. All price levels referenced are derived directly from TradingView chart data, and liquidation figures come from Coinglass. Always conduct independent research before making investment decisions.


















