Shiba Inu Price Prediction: SHIB Cools Off As Longs Get Flushed


A coin that spent last week breaking out of a channel it had been stuck in for months just gave a chunk of that move back, and the traders who chased the top are the ones paying for it. Nobody wants to admit they bought the spike. But the liquidation data does not really care what anyone wants, and that is exactly why Shiba Inu price prediction searches are climbing again.
So is this the end of the breakout, or just the market shaking out weak hands before another leg? That question is showing up everywhere in current meme coin price prediction chatter this week. Here is what the chart and the wallet data actually say.
Shiba Inu Price Prediction: Why SHIB Pulled Back After Its Breakout
Shiba Inu price prediction searches tend to spike whenever the chart does something dramatic, and this week it did. The token broke a months-long descending channel on the 4-hour timeframe, ran hard, and is now giving back part of that move.
Turns out the breakout itself was the easy part. Holding it is the harder question.
There is no listing news behind this. No partnership drop. Just leverage, both building and unwinding, on a token that a huge share of retail already holds.
We pulled the chart data, the on-chain holder breakdown, and the liquidation feeds to see whether this pullback is healthy or the start of something worse. What did we find?
Key Takeaways
-
SHIB trades near $0.000005048 as of the latest snapshot (July 27, 2026, roughly 09:40 UTC), down about 9.3% over 24 hours.
-
The 4-hour chart broke out of a descending channel, then cooled. RSI on that timeframe now reads 58.01, back near neutral after spiking well above 70.
-
Weekly RSI sits at 43.75, still under the 50 midline, meaning the bigger trend has not confirmed a reversal yet.
-
Liquidations hit $915.24K over 24 hours, and longs took the bulk of it every single window, from one hour out to a full day.
-
Circulating and total supply sit near 589.49T SHIB, but the real minted supply on Etherscan is closer to 999.98T Roughly 41% of that gross supply sits burned in a dead wallet.
-
Holder data shows real concentration: the top 100 wallets hold 83.16% of the tracked supply, and a chunk of the largest wallets are in exchange custody, not lone whales.
Token Contract
Contract Address: 0x95ad61b0a150d79219dcf64e1e6cc01f0b64ce
Standard: ERC-20
Security Rating: CertiK 4.5 / 5
Where SHIB Stands Right Now
SHIB last changed hands around $0.000005048, down roughly 9.3% over the past 24 hours per CoinMarketCap's SHIB listing. A separate exchange snapshot puts the drop closer to 8.27%, with a 24-hour range between $0.00000502 and $0.00000559. Small gaps like that between sources are normal. Worth noting anyway.
Volume over 24 hours came in near $391.35M against a market cap of roughly $2.97B, a vol-to-market-cap ratio of about 12.95%. Liquidity relative to market cap sits at just 0.14%, thin for a token this size.
Here's the thing: SHIB's supply numbers get confusing fast, so let's untangle them now, a follow-up to the numbers we tracked in our SHIB July 2026 outlook. Etherscan lists a gross minted supply of about 999.98T SHIB. CoinMarketCap lists total and max supply near 589.49T and circulating supply at 589.24T.
The gap is the burn. A single dead wallet holds 410.43T tokens, about 41% of everything ever minted. Once you exclude that, you land close to the 589T figure CMC actually reports.
That distinction matters for market cap too. Etherscan's raw on-chain market cap reads $5.09B, since it counts the burned tokens as if they were live. The circulating-supply market cap, the number that actually reflects tradable value, sits at $2.99B, matching CMC.
The all-time high, $0.00008845, was set back on October 28, 2021, roughly five years ago. The current price sits about 94.15% below that peak. The all-time low, a tiny $0.0000000008165, dates to August 27, 2020. Price today sits over 6.3 million percent above that floor, which sounds absurd until you remember what a six-year chart of a meme coin looks like, a contrast worth keeping in mind next to the supply mechanics covered in our Ethereum price prediction coverage.
Why Is SHIB Price Down Today
No single catalyst explains this pullback. What happened instead is simpler and messier at once.
Price ran hard into a breakout, the same move we flagged in SHIB breakout this week, drew in fresh leveraged longs chasing the move, and then cooled. That cooling forced a wave of long liquidations, which added its own downward pressure on top of ordinary profit-taking.
And that is a different setup than a coordinated sell-off. It is closer to a hangover after a party that got a little too loud.
Broader risk appetite across crypto has also softened this week, a backdrop worth reading alongside our latest crypto news rather than in isolation.
Technical Analysis: 4-Hour Chart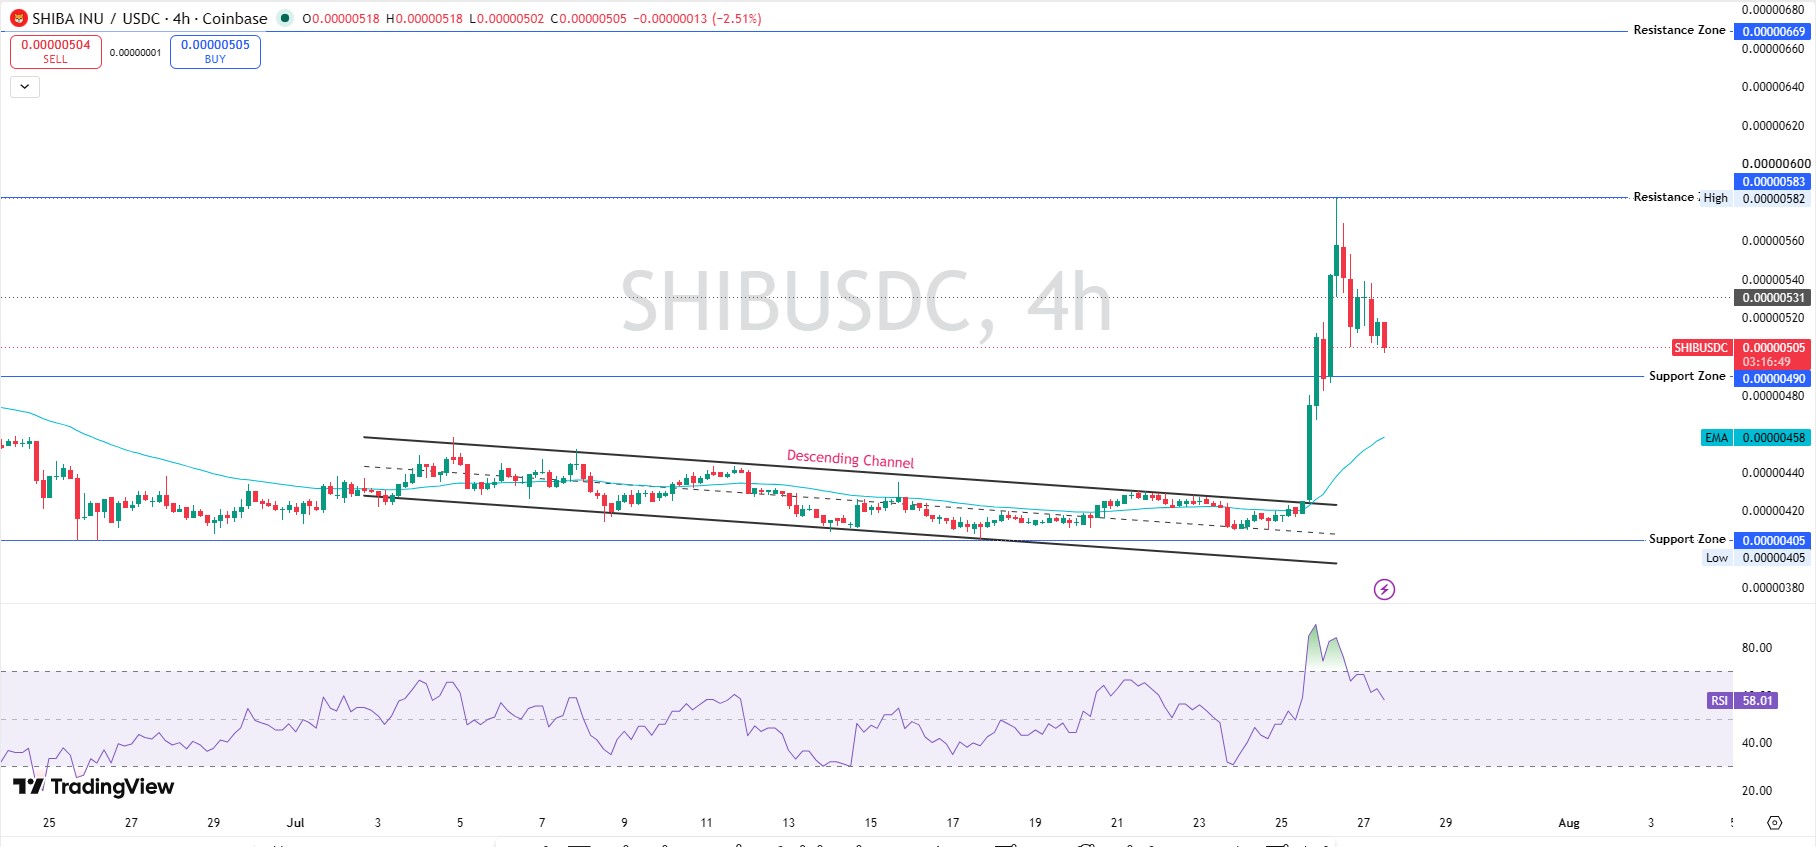
On the 4-hour SHIB/USDC chart, price broke cleanly out of a descending channel that had held for weeks, spiking from around $0.0000042 to a high near $0.00000582 before pulling back to roughly $0.00000505.
RSI on this timeframe now reads 58.01. That is down sharply from a spike well into overbought territory during the breakout candle itself, a classic sign of momentum cooling rather than reversing outright.
The EMA sits at $0.00000458, still below the current price. Short-term trend structure, for now, remains intact.
Support and Resistance Snapshot (4H)
| Level | Price |
|---|---|
| Resistance 2 | $0.00000669 |
| Resistance 1 | $0.00000582 |
| Current Price | $0.00000505 |
| Support 1 | $0.00000490 |
| Support 2 | $0.00000405 |
Support 1 sits uncomfortably close to the current price. That gap is not big. Watch it, especially after the setup we flagged in SHIB one step from exploding.
Technical Analysis: Weekly Chart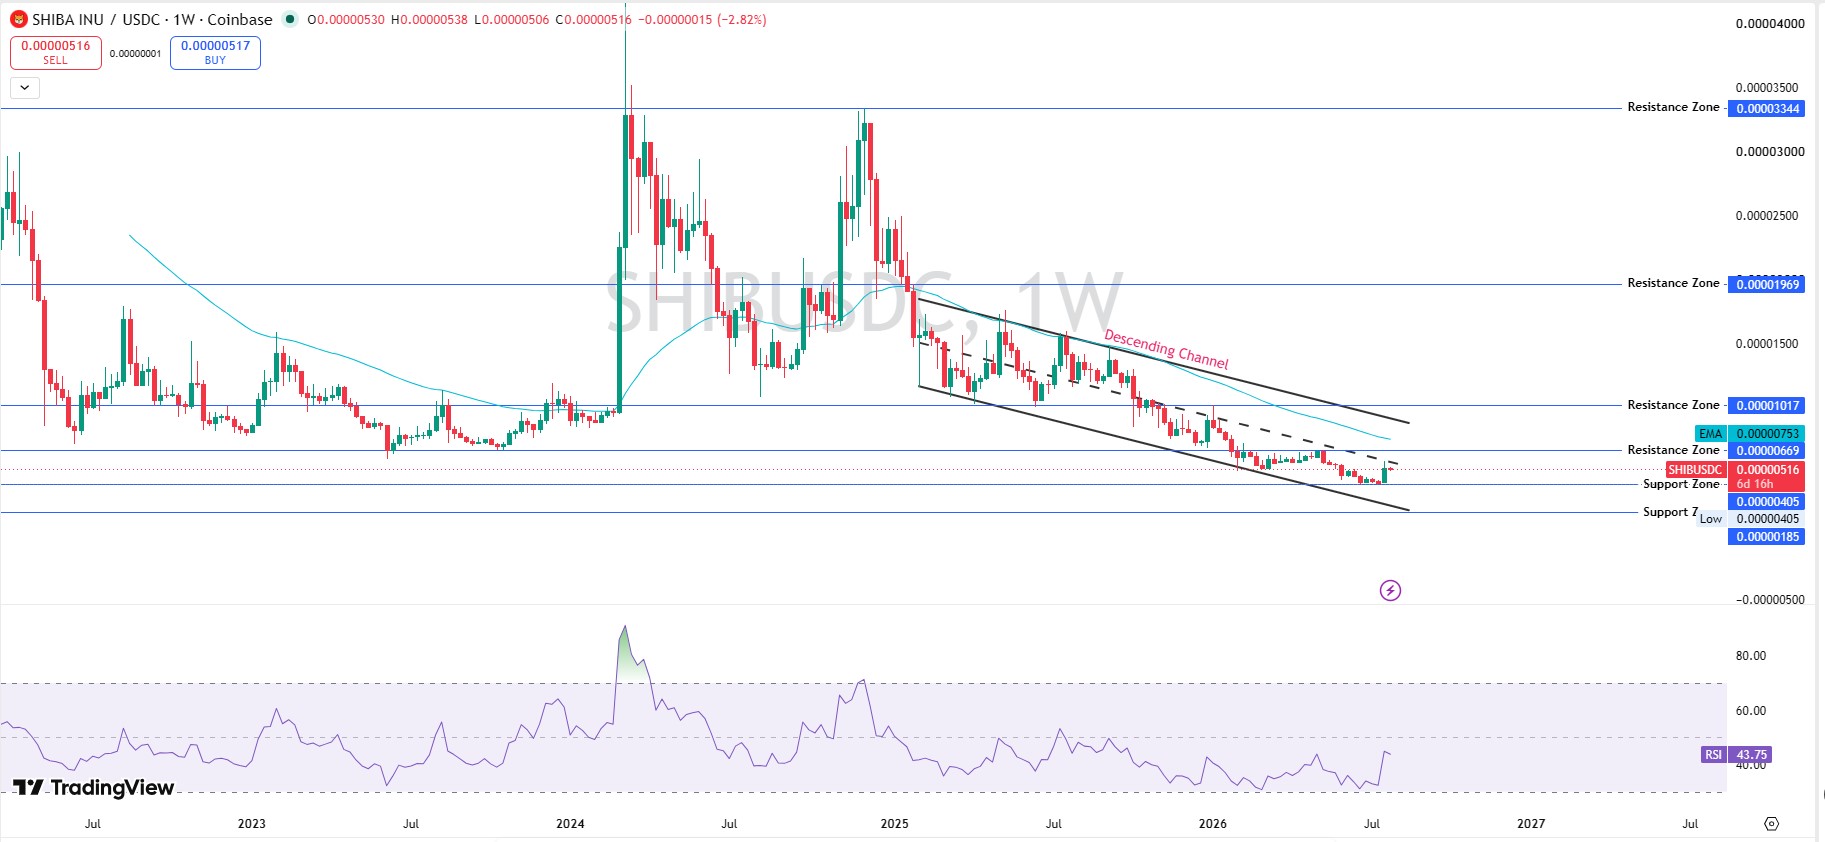
Zoom out and the picture gets more cautious. On the weekly chart, this week's candle opened near $0.00000530 and is currently trading around $0.00000516, down about 2.82% with several days left before the weekly close.
The weekly chart is still technically inside its own descending channel, one that stretches back into last year. The 4-hour breakout has not yet been confirmed on this bigger timeframe.
Weekly RSI reads 43.75, below the neutral 50 line. But it is not falling either; similar to the pattern flagged in the SHIB Superman recovery setup, it is sitting in a kind of holding pattern while the market decides what the breakout actually meant.
Support and Resistance Snapshot (Weekly)
| Level | Price |
|---|---|
| Resistance 3 | $0.00003344 |
| Resistance 2 | $0.00001969 |
| Resistance 1 | $0.00001017 |
| Near-term Resistance | $0.00000669 |
| Current Price | $0.00000516 |
| Support 1 | $0.00000405 |
| Support 2 | $0.00000185 |
The Long Liquidation Flush in Real Time
Breaking: Liquidation data flipped hard against longs the moment price started slipping.
Over the last hour, $48.86K got liquidated. Longs ate $44.02K of that. Shorts took just $4.84K.
Over 4 hours, total liquidations reached $86.63K, again dominated by longs at $54.16K against $32.47K short.
Zoom out to 12 and 24 hours, and the pattern holds. $282.65K over 12 hours and $915.24K over 24, and longs took the larger share in both windows.
That is the opposite pattern from a short squeeze. This is a long flush; leveraged buyers who chased the breakout are getting forced out as the price cools.
Liquidation Snapshot
| Window | Total | Long | Short |
|---|---|---|---|
| 1h | $48.86K | $44.02K | $4.84K |
| 4h | $86.63K | $54.16K | $32.47K |
| 12h | $282.65K | $211.51K | $71.14K |
| 24h | $915.24K | $613.82K | $301.42K |
Tokenomics and Holder Concentration
SHIB's contract is rated 4.5 out of 5 by CertiK, with holder data visible on Etherscan's token page. Total holder counts differ by source, though. CoinMarketCap lists roughly 3.06M holders, while Etherscan's own count sits near 1.68M. Anyone sizing a position should check both.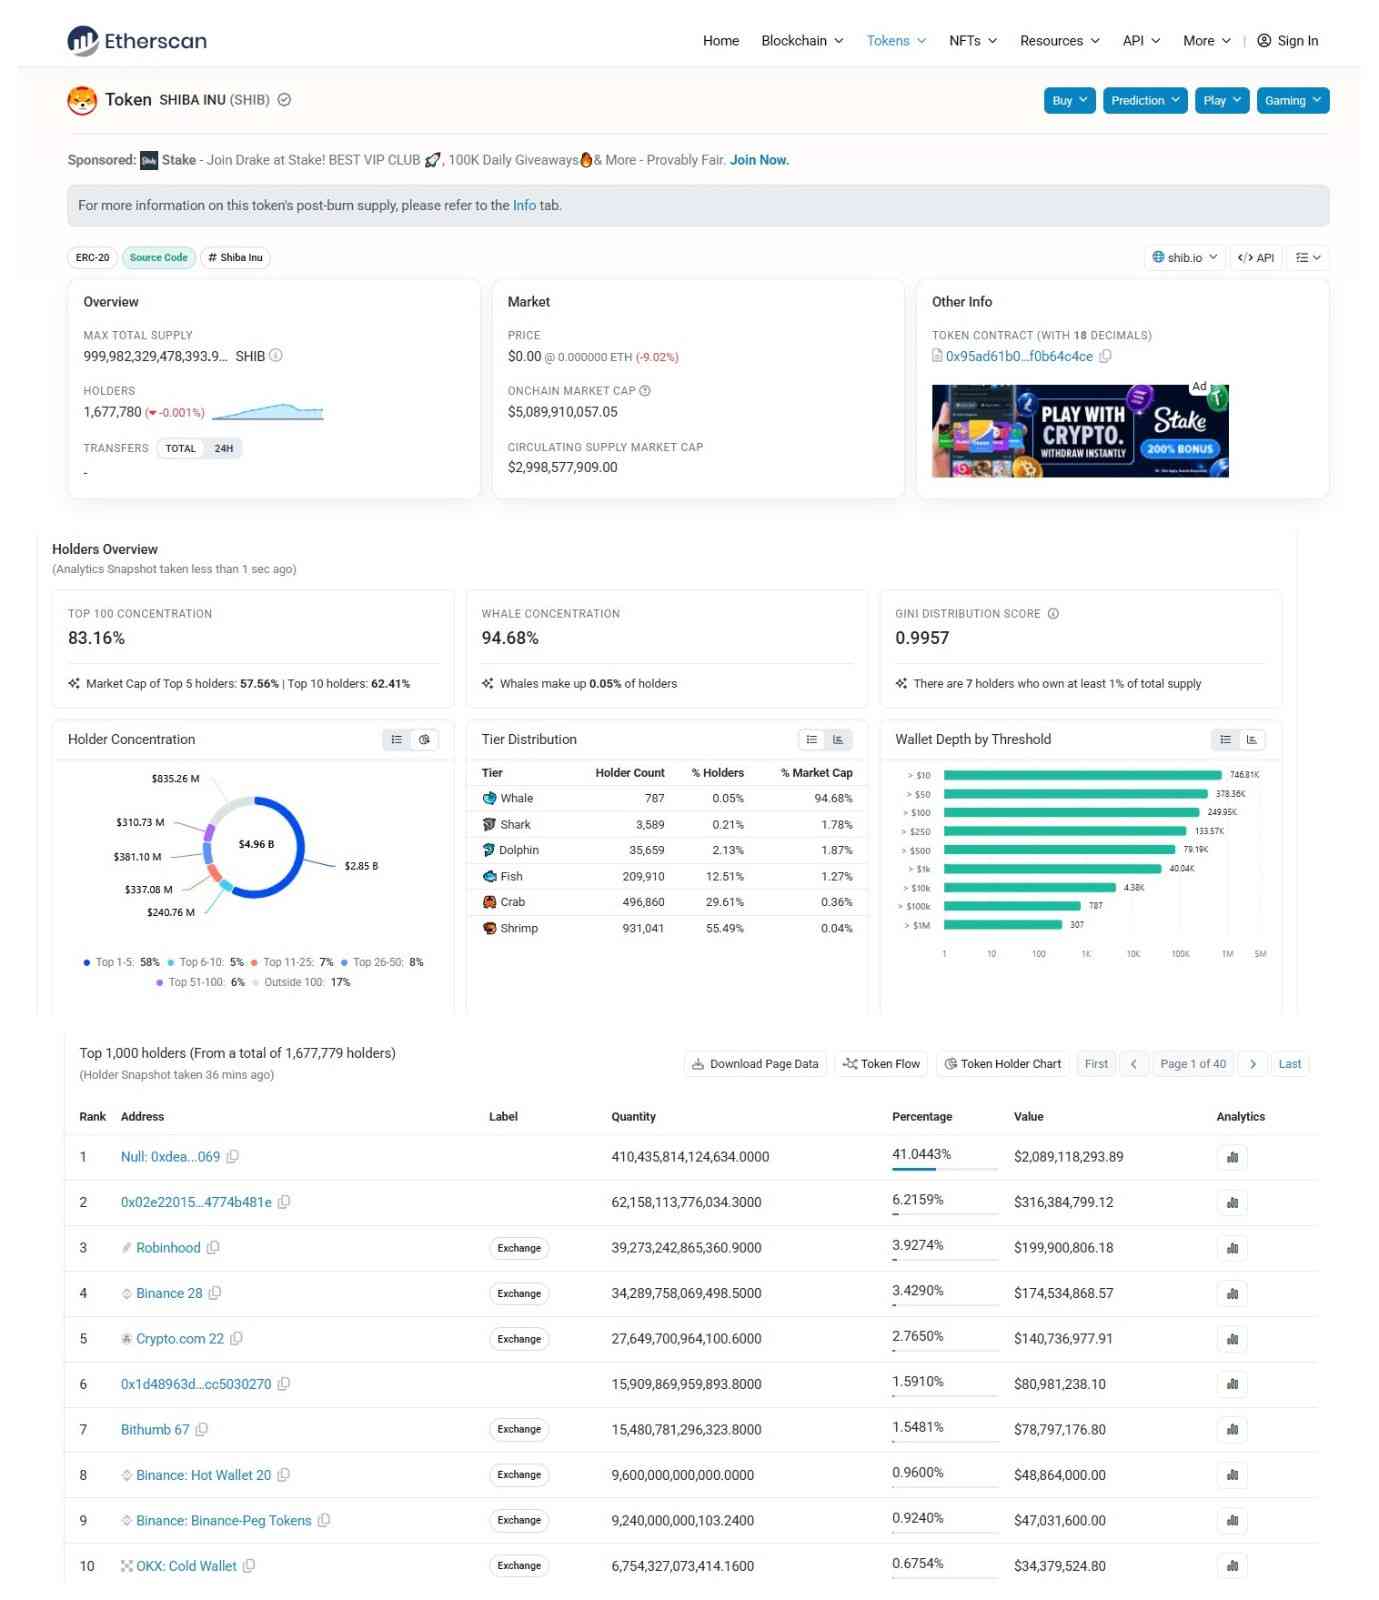
Concentration is real. Top 100 wallets control 83.16% of tracked supply. A narrower "whale" tier, just 787 wallets, about 0.05% of all holders, controls 94.68% of market cap by Etherscan's own tiering. The Gini distribution score sits at 0.9957, close to maximum inequality. Seven wallets each hold at least 1% of the total supply.
But raw numbers hide the real story here. The single largest wallet, holding 41.04% of gross supply, is not a whale at all. It is the dead burn address.
Past that, the picture shifts again. Rank two is an unlabeled wallet at 6.22%, genuinely worth watching. Ranks three through five are exchange custody wallets: Robinhood at 3.93%, Binance at 3.43%, and Crypto.com at 2.77%, holding tokens on behalf of many retail users rather than one accumulating party. Rank six is another unlabeled wallet at 1.59%. Rank seven is Bithumb exchange custody at 1.55%.
So real, unaccounted concentration risk mostly comes down to two unlabeled wallets. Everything else is either burned or sitting in exchange's cold storage.
Liquidity and Exchange Volume
Liquidity relative to market cap sits at just 0.14%, thin compared to many established large caps, and futures volume skews heavily toward one venue.
OKX leads by a wide margin, with MEXC, LBank, Bitget, and Bitunix trailing well behind, a spread worth checking against current crypto exchange listings.
Futures Volume by Exchange
| Exchange | 24H Futures Volume |
|---|---|
| OKX | $262.54M |
| MEXC | $71.61M |
| LBank | $68.81M |
| Bitget | $68.72M |
| Bitunix | $30.68M |
| Gate | $23.50M |
Single-exchange dominance on derivatives means leveraged positioning, not spot demand, is doing most of the work in this pullback.
Bull, Base, and Bear Scenarios
None of this is financial advice. These are scenario estimates built from current chart structure, not guarantees, and worth reading alongside the wider crypto price prediction hub for broader market context.
Bull Case: A daily close back above $0.00000582 opens a path toward $0.00000669 within 7 to 14 days. Probability roughly 25%, contingent on long liquidations drying up and buyers stepping back in. Invalidation: a daily close below $0.0000047.
Base Case: Price consolidates roughly between $0.0000047 and $0.0000058 over the next 7 to 30 days while leveraged positioning resets. The probability is highest, around 50%. Invalidation: a clean break outside either boundary on rising volume.
Bear Case: Momentum fades further and price retests the $0.00000490 support, with a deeper move toward $0.00000405 possible within 30 days if broader sentiment stays weak. The probability is roughly 25%. Invalidation: sustained volume holding above $0.0000052 for more than a week.
Price Forecast Table
| Timeframe | Bear | Base | Bull |
|---|---|---|---|
| 24H | $0.0000047 | $0.0000051 | $0.0000056 |
| 7D | $0.0000042 | $0.0000052 | $0.0000066 |
| 30D | $0.0000035 | $0.0000050 | $0.0000085 |
| Long Term (2026) | $0.0000025 | $0.0000060 | $0.0000150 |
These are ranges built around the support and resistance levels already on the chart, not certainties.
Key Risks
The weekly RSI still sitting under 50 tops the list. It means the bigger trend has not confirmed the breakout yet, even after a sharp short-term move.
Liquidity relative to market cap is thin at 0.14%, which can make moves in either direction sharper than they'd otherwise be.
Holder data has real gaps between sources, and while much of the top concentration traces to burn and exchange wallets rather than lone whales, two unlabeled large wallets remain a genuine unknown.
Single-exchange futures dominance means this move stays leverage-driven for now. Sector-wide swings can override any token-specific setup, so this chart should get read alongside our Bitcoin price prediction coverage rather than by itself.
Glossary
RSI: A 0-100 momentum indicator. Above 70 typically signals overbought; below 30 signals oversold.
EMA: A trend-following average that weights recent prices more heavily than older ones.
FDV: What the market cap would be if every token that will ever exist were already circulating.
Gini Score: A measure of distribution inequality, from 0 to 1.
Liquidation: The forced closing of a leveraged position when losses exceed the trader's margin.
Burn Address: A wallet nobody controls, used to permanently remove tokens from usable supply.
Invalidation Level: The price point at which a trading thesis is considered wrong and should be dropped.
Disclaimer: This article is for informational purposes only and does not constitute financial advice. Cryptocurrency markets are highly volatile. Always do your own research and consult a licensed financial advisor before making investment decisions.
Also read: