Shiba Inu Price Prediction: $SHIB Superman Recovery Flight

$SHIB has been quietly setting up something worth watching, and most people scrolling past the charts are going to miss it.
This Shiba Inu price prediction breaks down exactly what's building right now and why the next few candles matter more than usual
Where SHIB Sits Right Now
$SHIB is currently trading around $0.00000419, up roughly 1% after tagging a low of $0.00000414.
On-chain market cap sits near $4.18 billion, while circulating-supply market cap is closer to $2.46 billion, a reminder that SHIB's headline supply and its actual tradeable float are two different numbers.
Levels below reflect this snapshot; if the price moves meaningfully past either boundary, treat the numbers as due for a refresh.
Shiba Inu Coin News: The Sentiment Angle
A widely shared Shiba Inu Final community message-style post this week summarized two AI models' views on $SHIB, as per a BSCNews report on X.
Both pointed to modest, not explosive, gains through year-end 2026, citing community strength as SHIB's biggest asset while flagging that Shibarium adoption still hasn't proven strong enough for a major breakout. 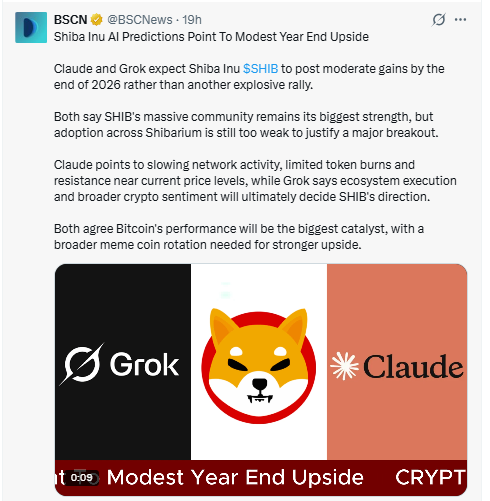
One model flagged slowing network activity and limited burns near current levels; the other tied direction more to ecosystem execution and broader sentiment.
Both agreed Bitcoin's performance is the biggest external catalyst. Treat this as color, not a confirmation of the technical setup.
Shiba Inu Whale Activity
Anyone asking, will Shiba Inu go up? should look past the chart at who holds it. The top 100 wallets control 83.15% of the supply, and whale concentration sits at 94.46%.
Whale-tier wallets are just 0.04% of holders but control almost all the value. The Gini score is 0.9957, and only 7 wallets each hold at least 1% of the supply. 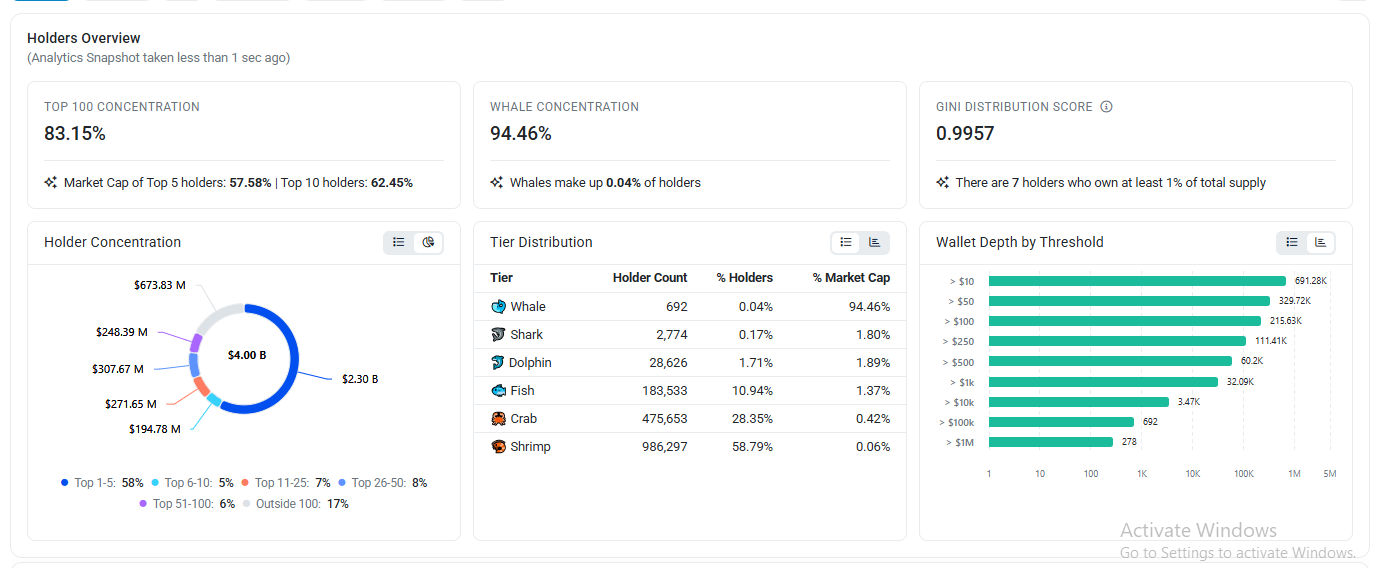
Source: Data According to etherscan
Over 1.6 million smaller wallets (fish, crab, and shrimp tiers) split under 2% combined.
This explains why SHIB can swing sharply on modest volume and why a trendline breakout here could move fast in either direction.
4-Hour Chart: Boxed Inside a Descending Channel
On the 4H chart, $SHIB sits inside a descending channel near $0.00000420, between the 0.618 retracement ($0.00000426) and 0.786 retracement ($0.00000417), too close to the channel floor to call it strong and too close to resistance to call it weak. 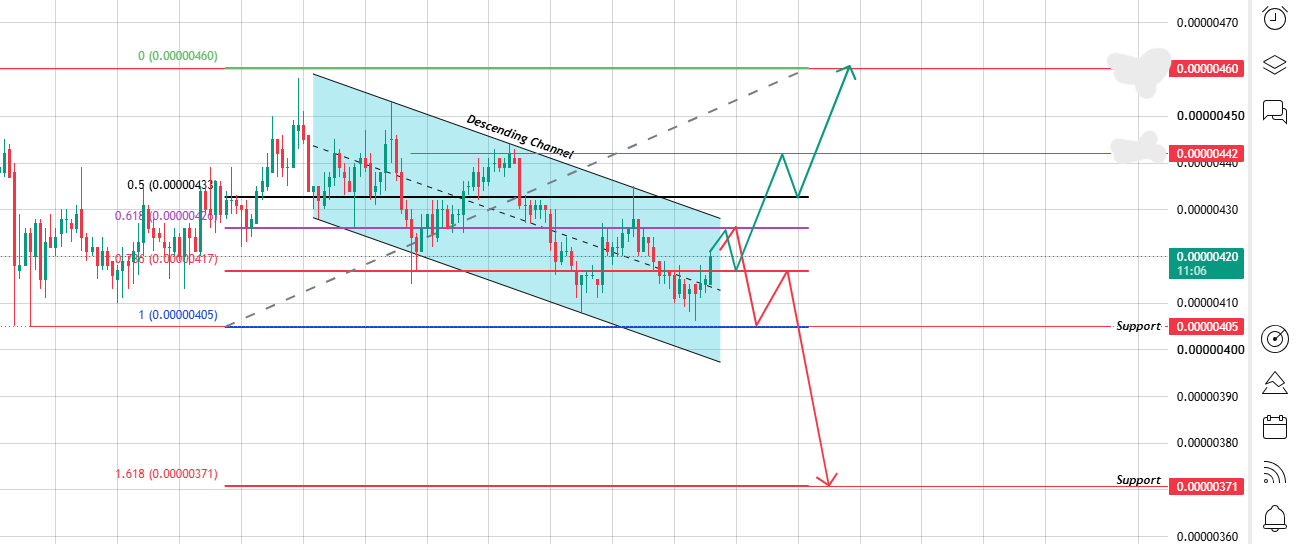
Source: Chart Taken From TradingView
Reclaim $0.00000426, and the next stop is the $0.00000442–$0.00000460 zone.
Lose the channel floor at $0.00000405, and there's little standing between the price and $0.00000371, the same level flagged on the daily chart.
| 4H Level | Price | Importance |
|---|---|---|
| Resistance 2 | $0.00000460 | Channel's upper boundary |
| Resistance 1 | $0.00000426 | 0.618 Fib retracement |
| Support 1 | $0.00000405 | Channel floor & 1.0 Fib level |
| Support 2 | $0.00000371 | 1.618 Fib extension |
Will SHIB Hit $1?
Shiba Inu $1 predictions circulate constantly, but the math doesn't work.
The circulating supply sits around 588 trillion tokens; at $1 each, that's a $588 trillion market cap, over five times global GDP and bigger than every public company combined.
A more realistic stretch target is $0.0001, itself a 20x+ move, needing a $58 billion cap. That's still a big ask, but it's at least within the range of things crypto has done before.
Daily Chart: Leaning Into a Falling Trendline
SHIB has spent weeks under a falling trendline that's capped every bounce so far, and price has now climbed back up into it from below, boxed into a tight consolidation rather than a clean move. 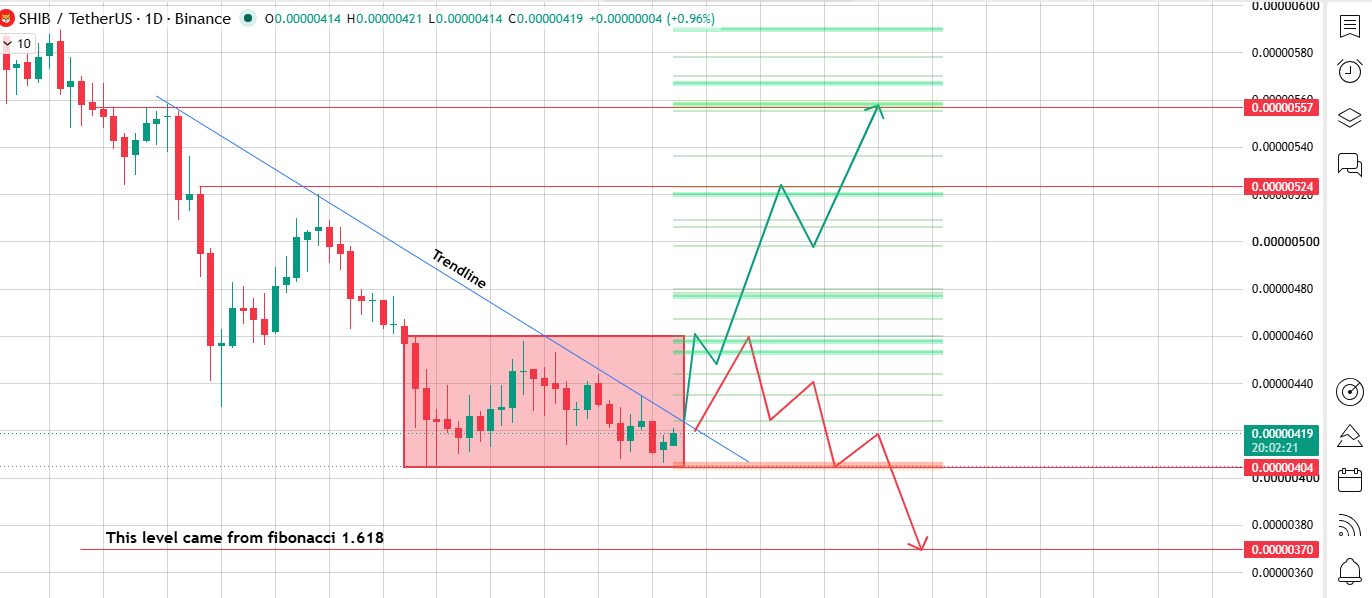
Source: Chart Taken From TradingView
The $0.00000404 line at the base of that box is the support zone that matters most; it's held on every retest but hasn't faced real pressure yet.
A daily close above the trendline that actually sustains opens the first price target at $0.00000524, then $0.00000557 if momentum carries through.
If the breakout fails, or $0.00000404 breaks first, the next level is $0.00000370, the 1.618 Fibonacci extension measured off the prior swing.
| 1D Level | Price | Importance |
|---|---|---|
| Resistance 2 | $0.00000557 | Extended bullish target |
| Resistance 1 | $0.00000524 | Trendline breakout target |
| Support 1 | $0.00000404 | Base of consolidation, being tested |
| Support 2 | $0.00000370 | 1.618 Fib extension, bearish target |
SHIB vs. Other Large-Cap Memecoins
| Coin | Structure | Key Support | Difference |
|---|---|---|---|
| SHIB | Descending channel + trendline | $0.00000404 / $0.00000405 | Deflationary via burns |
| DOGE | Fib retracement + trendline | 100% retracement zone | Fixed annual issuance |
| PEPE | Range-bound | Prior demand zone | Fully diluted at launch |
Price Scenarios
| Scenario | Trigger | Targets |
|---|---|---|
| Bullish Breakout | Daily close above the trendline / 4H reclaim $0.00000426 | $0.00000524 $0.00000557 |
| Neutral | Price stays $0.00000404–$0.00000426 | Continued chop |
| Bearish Breakdown | Daily loss of $0.00000404 / 4H loses $0.00000405 | $0.00000370 |
What Would Invalidate This Setup
A wick through $0.00000524 or $0.00000404 alone doesn't confirm anything; this read needs a full daily or 4H close beyond those levels.
$SHIB is high-beta and sentiment-driven, so a sudden BTC dominance shift can override the technical picture fast, and given the whale concentration above, sharp wicks are possible without a genuine trend change.
Glossary
Fibonacci retracement/extension: levels used to estimate where a pullback pauses or extends.
Descending channel: a downtrend bound by two parallel falling lines.
Whale concentration: the share of supply held by the largest wallets.
Final Outlook
According to Coingabber market analyst, SHIB's near-term direction comes down to one test: does the daily trendline finally break, or does it cap the price again?
ETH correlation and broader risk appetite matter too, since SHIB tends to move with the wider memecoin complex.
If Bitcoin holds steady and the trendline breaks with a real close, $0.00000524 and then $0.00000557 come into range.
If it rejects again and $0.00000404 gives way, $0.00000370 is next. SHIB is sitting exactly on the fence that decides which plays out.
Disclaimer: This article is for informational purposes only and should not be considered financial advice. Cryptocurrency markets are highly volatile; always do your own research before making investment decisions.
Also read:
2 months ago
I have been a crab fisherman for 40 years. I started working at a local fish plant a few years ago. I love playing lotto bets, so I buy lotto tickets often but find it difficult to win. I read about Lord Bubuza's lottery spells on the internet, so I contacted him for help to win Lotto 649. He told me that he would need to cast a lotto spell so that he can reveal the lotto numbers I will choose. I was sceptical, but my wife Nancy told me to give it a try. I provided his requirements to cast the lotto spells, and he gave me the numbers. I bought a Lotto 649 ticket and played as Lord Bubuza instructed, to my surprise it was a big win. I won $64,000,000. My partner Nancy and I travelled to the Atlantic Lottery in Moncton to confirm the win and collect the prize. I will retire from my crab fishing with this win and continue to recommend lord Bubuza. Join me and appreciate Lord Bubuza for his help via Email: lordbubuzamiraclework@hotmail.com or WhatsApp: +1 (365) 808 5313

2 months ago
I have been a crab fisherman for 40 years. I started working at a local fish plant a few years ago. I love playing lotto bets, so I buy lotto tickets often but find it difficult to win. I read about Lord Bubuza's lottery spells on the internet, so I contacted him for help to win Lotto 649. He told me that he would need to cast a lotto spell so that he can reveal the lotto numbers I will choose. I was sceptical, but my wife Nancy told me to give it a try. I provided his requirements to cast the lotto spells, and he gave me the numbers. I bought a Lotto 649 ticket and played as Lord Bubuza instructed, to my surprise it was a big win. I won $64,000,000. My partner Nancy and I travelled to the Atlantic Lottery in Moncton to confirm the win and collect the prize. I will retire from my crab fishing with this win and continue to recommend lord Bubuza. Join me and appreciate Lord Bubuza for his help via Email: lordbubuzamiraclework@hotmail.com or WhatsApp: +1 (365) 808 5313
2 months ago
I have been a crab fisherman for 40 years. I started working at a local fish plant a few years ago. I love playing lotto bets, so I buy lotto tickets often but find it difficult to win. I read about Lord Bubuza's lottery spells on the internet, so I contacted him for help to win Lotto 649. He told me that he would need to cast a lotto spell so that he can reveal the lotto numbers I will choose. I was sceptical, but my wife Nancy told me to give it a try. I provided his requirements to cast the lotto spells, and he gave me the numbers. I bought a Lotto 649 ticket and played as Lord Bubuza instructed, to my surprise it was a big win. I won $64,000,000. My partner Nancy and I travelled to the Atlantic Lottery in Moncton to confirm the win and collect the prize. I will retire from my crab fishing with this win and continue to recommend lord Bubuza. Join me and appreciate Lord Bubuza for his help via Email: lordbubuzamiraclework@hotmail.com or WhatsApp: +1 (365) 808 5313
2 months ago
I have been a crab fisherman for 40 years. I started working at a local fish plant a few years ago. I love playing lotto bets, so I buy lotto tickets often but find it difficult to win. I read about Lord Bubuza's lottery spells on the internet, so I contacted him for help to win Lotto 649. He told me that he would need to cast a lotto spell so that he can reveal the lotto numbers I will choose. I was sceptical, but my wife Nancy told me to give it a try. I provided his requirements to cast the lotto spells, and he gave me the numbers. I bought a Lotto 649 ticket and played as Lord Bubuza instructed, to my surprise it was a big win. I won $64,000,000. My partner Nancy and I travelled to the Atlantic Lottery in Moncton to confirm the win and collect the prize. I will retire from my crab fishing with this win and continue to recommend lord Bubuza. Join me and appreciate Lord Bubuza for his help via Email: lordbubuzamiraclework@hotmail.com or WhatsApp: +1 (365) 808 5313
2 months ago
Hello everyone, greetings from Miss Shanghai Carlo, i was a victim of online scam, got registered on a trading website which turns out to be scam, they call their brand FX pro trader, i work for a popular organization and i handle the payroll, after losing all my funds to scammer, they hacked into my Email and divert all payment to unknown account which were only able to decode by Alien Wizbot hack service tools, during the recovering process the scammers phone were hacked in other to get them arrested, don't just recover your funds but also get them arrested, this differentiate the real hacker from impersonator's. today i am happy to write here and to inform you all that I regained my work position and all funds recovered, lastly, the thieves are serving in prison now, God bless America. reach alienwizbot(@)gmail(.)com for help or Whatsapp +16262645164
2 months ago
I have had my own share of binary option scam, I lost over 22k USD, and i was still told to send more money to unlock my account. I reached out to recoverydarek@gmail.com and they helped me get my money back. If you have ever been scammed or you know someone that has been scammed, recoverydarek@gmail.com will get the money back. They are a recovery team that specialize in funds recovery, be it cryptocurrency , bitcoin, forex, catfish/romance scam. They are very real.
2 months ago
Hello everyone, I'm Charlene from USA. When my online platform account was suddenly frozen and I lost access to $520,500, I wasn’t sure how to move forward. I came across DAREK RECOVERY and decided to reach out on recoverydarek @ gmail .com. From the outset, they were honest and transparent, clearly outlining the recovery process without making unrealistic assurances. They provided regular updates throughout, and I’m happy to say that every dollar was successfully recovered. Their professionalism and clear communication made a very stressful experience far easier to handle, and I’m sincerely thankful for their support in recovering my funds back from those scammers.
















