Solana Eyes Breakout as Morgan Stanley Launches SOL ETP, URPD Data


Solana is sitting at a make-or-break level right now. The price is hovering close to $73.75, a spot that traders are watching closely this week.
This zone matters because a large amount of SOL changed hands here before. That makes it one of the most important support levels on the chart today.
If Solana holds this level, buyers may get another shot at pushing prices higher. If it breaks, the drop could be sharp.
Why is $73.75 such an important level for Solana?
On-chain data from Glassnode shows more than 50 million SOL tokens were bought around the $73.75 mark. This is shown in the URPD (Realized Price Distribution) chart shared by analyst Ali Charts.
That much buying activity at one price point tends to create a wall. Traders often defend levels where they first entered a position.
A close below this zone, sustained over multiple days, could open the door to more selling. Analysts point to $60 as the next major downside target if that happens.
Below $60, there isn't much support until prices reach $50.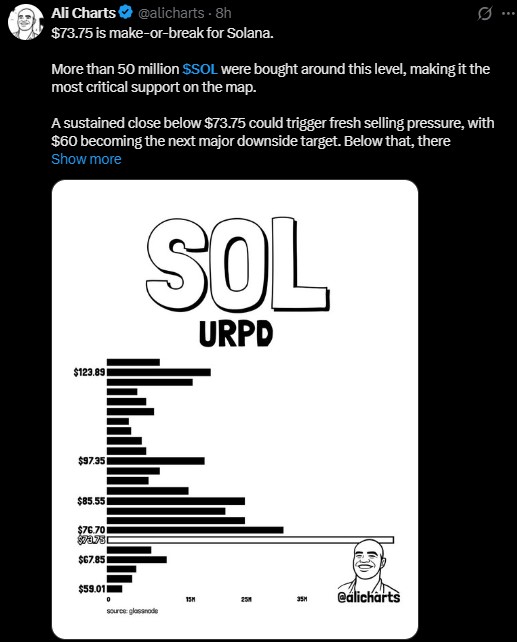
What does the SOL/USDT chart show right now?
Looking at the daily chart on KuCoin, SOL is trading inside a wider rising channel. This channel has been in place since February.
That's a sign the bigger trend is still holding up, even after the recent pullback from July highs near $84.
Inside that larger channel, a smaller pattern has formed, and it sits between roughly $73 and $92.
Right now, SOL is testing the lower edge.
The RSI, a momentum indicator, sits at 44.39. That's below the neutral 50 mark but not yet in oversold territory. It suggests selling pressure is easing, though it hasn't fully reversed.
What price levels should traders watch for Solana?
Level Type | Price | What It Means |
Critical support | $73.75 | Heavy buying zone, key line in the sand |
Resistance | $76–$78 | Break above could confirm bullish reversal |
Upside target 1 | $82 | First resistance if it breaks up |
Upside target 2 | $88–$92 | Aligns with upper channel boundary |
Downside target 1 | $68–$64 | Likely if $72–$73 fails to hold |
Downside target 2 | $60 | Major support if selling accelerates |
Downside target 3 | $50 | Little support below this point |
Is institutional demand still supporting Solana?
Yes, and this part of the story is new. Morgan Stanley has expanded its crypto lineup by launching exchange-traded products tied to both Ethereum and Solana.
This follows the bank's earlier Bitcoin fund, which has already crossed $381 million in assets.
Data from SoSoValue shows total net assets across SOL ETPs now sit at $851.84 million, close to 2% of Solana's total market cap.
Daily net inflow was negative on July 28, at -$18.07 million, mostly from the Bitwise BSOL fund. Still, cumulative net inflow across all products remains positive at $1.13 billion.
This shows long-term institutional interest hasn't disappeared, even with a rough short-term day.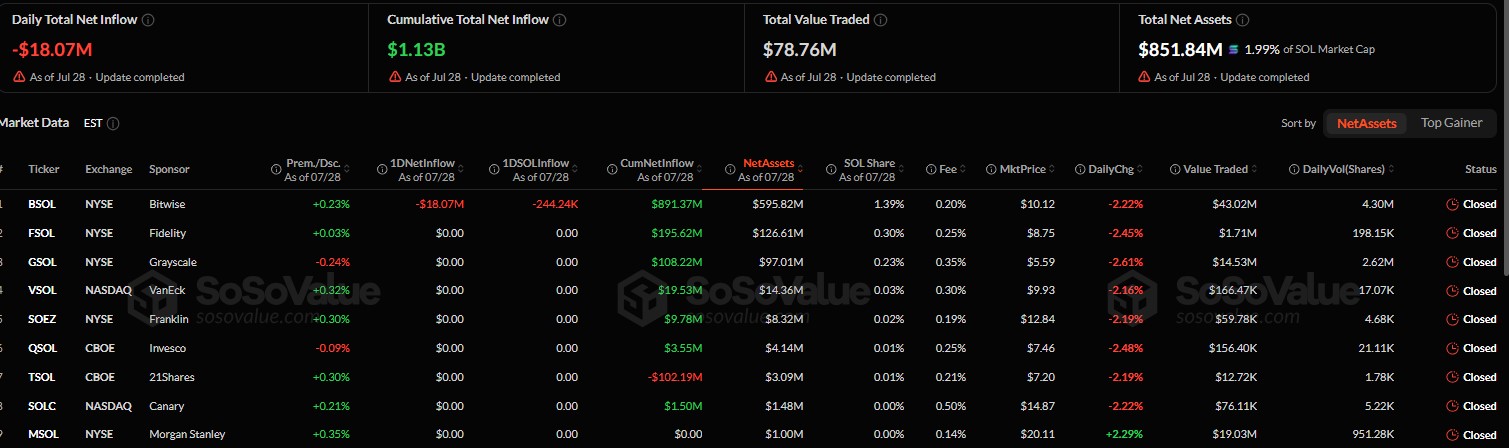
Solana Price Prediction: Where could SOL price go next?
Nobody can say for certain where Solana price will land next. But the setup gives traders a clear map to watch.
If buyers step in near $73.75 and push above the resistance around $76 to $78, a move toward $82 becomes possible. A stronger breakout could extend that toward $88 to $92.
On the flip side, a break below $72 to $73 would weaken the bullish case. That could send Solana toward $68, or even $64, before any recovery attempt.
The broader ascending channel is still intact for now. As long as that holds, the bigger picture leans cautiously bullish, but a confirmed breakout is needed to build real confidence.
Traders should watch daily closes near $73.75 closely over the coming sessions, since this level looks set to decide Solana's next direction.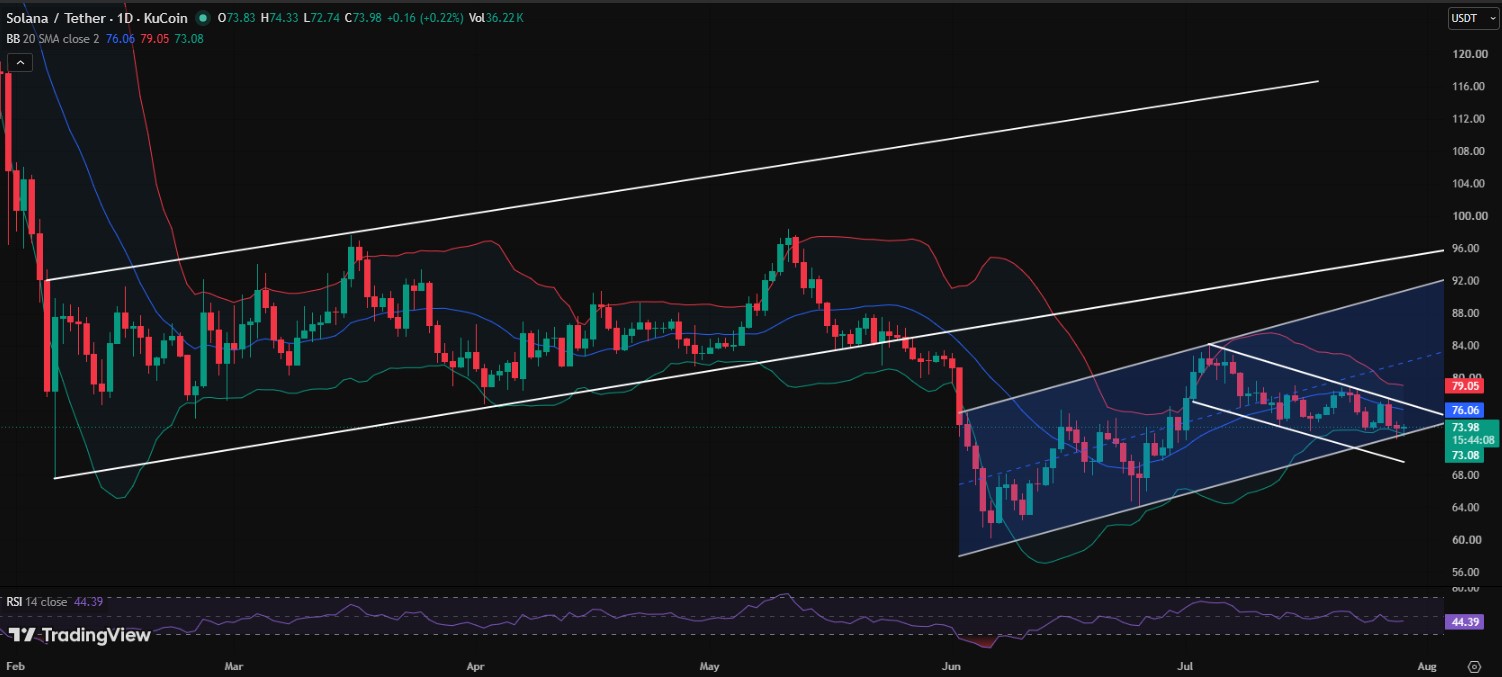
Disclaimer
This article is for informational purposes only and does not constitute financial, investment, or trading advice. Cryptocurrency markets are highly volatile and unpredictable. Always do your own research (DYOR) and consult a licensed financial advisor before making any investment decisions. Past performance is not indicative of future results.









.jpg)








