COTI Price Prediction: $COTI Privacy Narrative, Bulls Break $0.013046?


COTI just broke out of a months-long downtrend, spiking roughly 13% in a single day as its privacy narrative gains fresh attention across the market.
The project builds privacy infrastructure for existing blockchains, letting institutions run compliant, confidential transactions without exposing every client and counterparty on-chain.
This COTI Price Prediction looks at whether the breakout holds. Here's the full breakdown.
COTI price today: COTI Market Overview
| Metric | Value |
| Price | $0.01240 |
| 24h Change | +1.1% |
| Market Cap | $36.7M (+1.16%) |
| 24h Volume | $115.9M (−2.4%) |
| Vol/Mkt Cap (24h) | 335.17% |
| FDV | $60.92M |
| Liq/Mkt Cap | 0.55% |
| Total Supply | $2.95B COTI |
| Max Supply | 4.91B $COTI |
| Circulating Supply | $2.95B $COTI |
| Holders | 45.17K |
Source: Data from CoinMarketCap as of 29/07/2026. Figures may vary slightly across other tracking websites.
COTI forecast 2026: Holder Data and On-Chain Overview
COTI's holder base is fairly concentrated: whale wallets make up just 0.14% of holders but control 78.36% of market cap, and the top 100 addresses hold 84.84% of total supply. 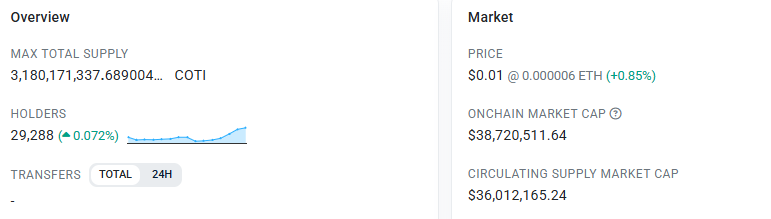
A Gini score of 0.981 backs this up, with 25 wallets each owning at least 1% of supply and the top 10 holders alone accounting for 43.01% of market cap.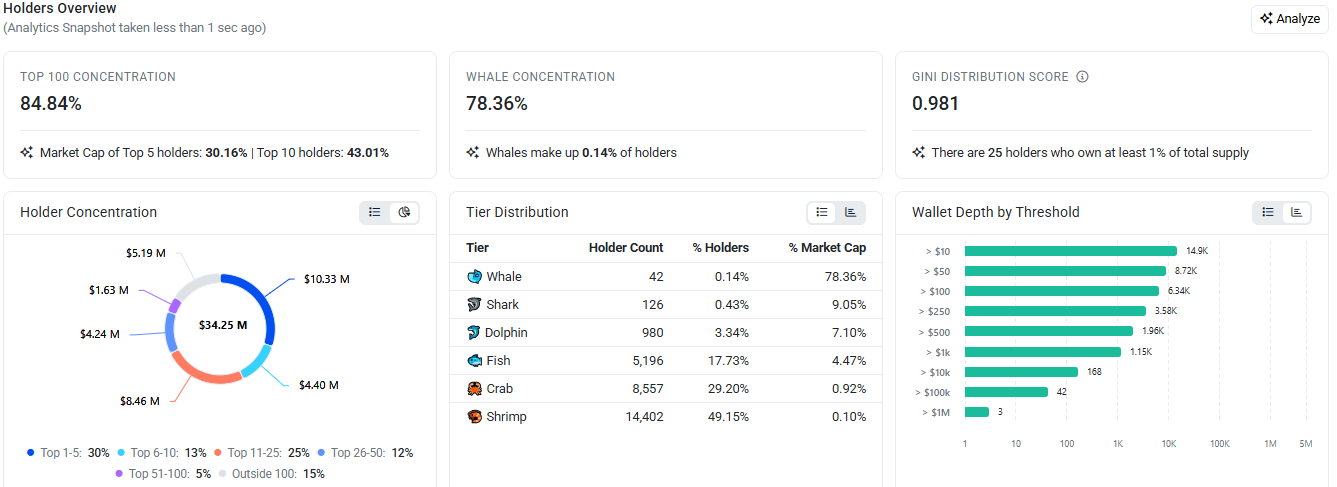
Separately, on-chain overview data puts max total supply at roughly 3.18B COTI across 29,288 holders a lower count than the 45.17K shown on the market tracker, likely reflecting a different data provider's snapshot
With an on-chain market cap of $38.72M against a circulating-supply market cap of $36.01M, broadly consistent with the $36.7M figure above.
COTI crypto news: COTI Foundation's Latest Update
The $COTI Foundation argued that institutions won't tokenize large volumes onto chains that expose every client, transaction, and counterparty, positioning its "Privacy-on-Demand" feature as a way to bring compliant privacy to chains institutions are already building on.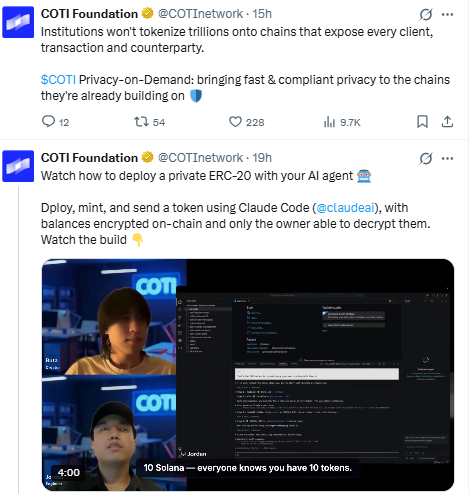
Source: Data From X
demoed deploying a private ERC-20 token using an AI coding agent, with balances encrypted on-chain and only the token owner able to decrypt them.
COTI price prediction: Short-Term Chart Analysis
Pair: $COTI/USDT · Market: Spot · Timeframe: 1H · Source: TradingView · Timestamp: July 29, 2026, 12:23 UTC+5:30
$COTI trades at $0.012218. The price has reclaimed a descending trendline that had captured every bounce over the past few days and is now holding above the EMA 20 ($0.011497). RSI (14) at 55.98 is neutral-to-firm, leaving room to run before hitting overbought territory on this timeframe.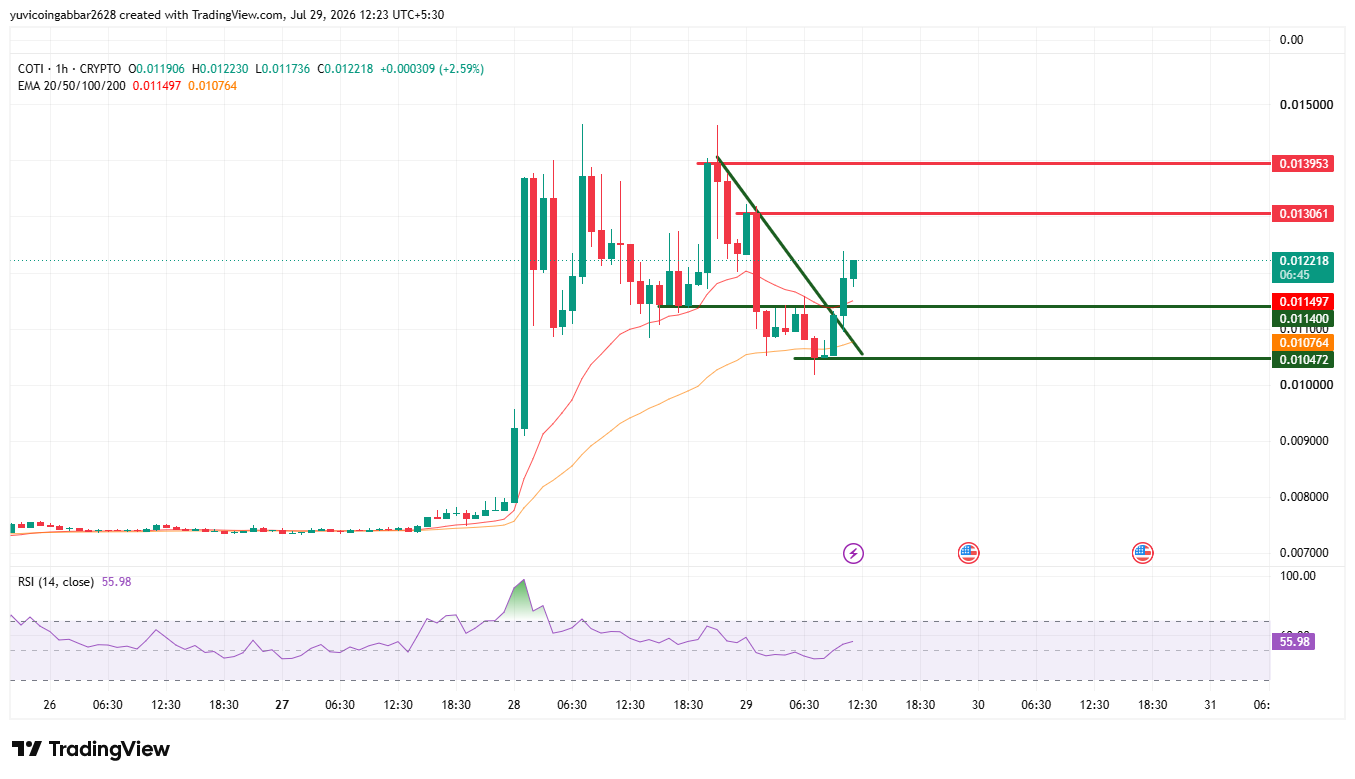
| Level Type | Price | Label |
| Resistance 2 | $0.013953 | Prior high, bull target |
| Resistance 1 | $0.013061 | Near-term supply zone |
| Immediate Price Reference | $0.012218 | Current price |
| First Confirmed Support | $0.011497 | EMA 20 |
| Support 2 | $0.011400 | Prior consolidation floor |
| Deeper Support | $0.010764 | EMA 50 |
| Floor Support | $0.010472 | Breakdown-risk floor |
COTI price prediction 2026: Long-Term Chart Analysis
Pair: $COTI/USDT · Market: Spot · Timeframe: 1D · Source: TradingView · Timestamp: July 29, 2026, 12:25 UTC+5:30
On the daily chart, $COTI spent most of the July inside a steep descending trendline, bottoming out in a consolidation zone before a breakout candle that closed up 13.11%.
RSI (14) has spiked to 81.66, deep in overbought territory, a caution flag that raises the odds of a near-term pause even as the broader structure turns constructive.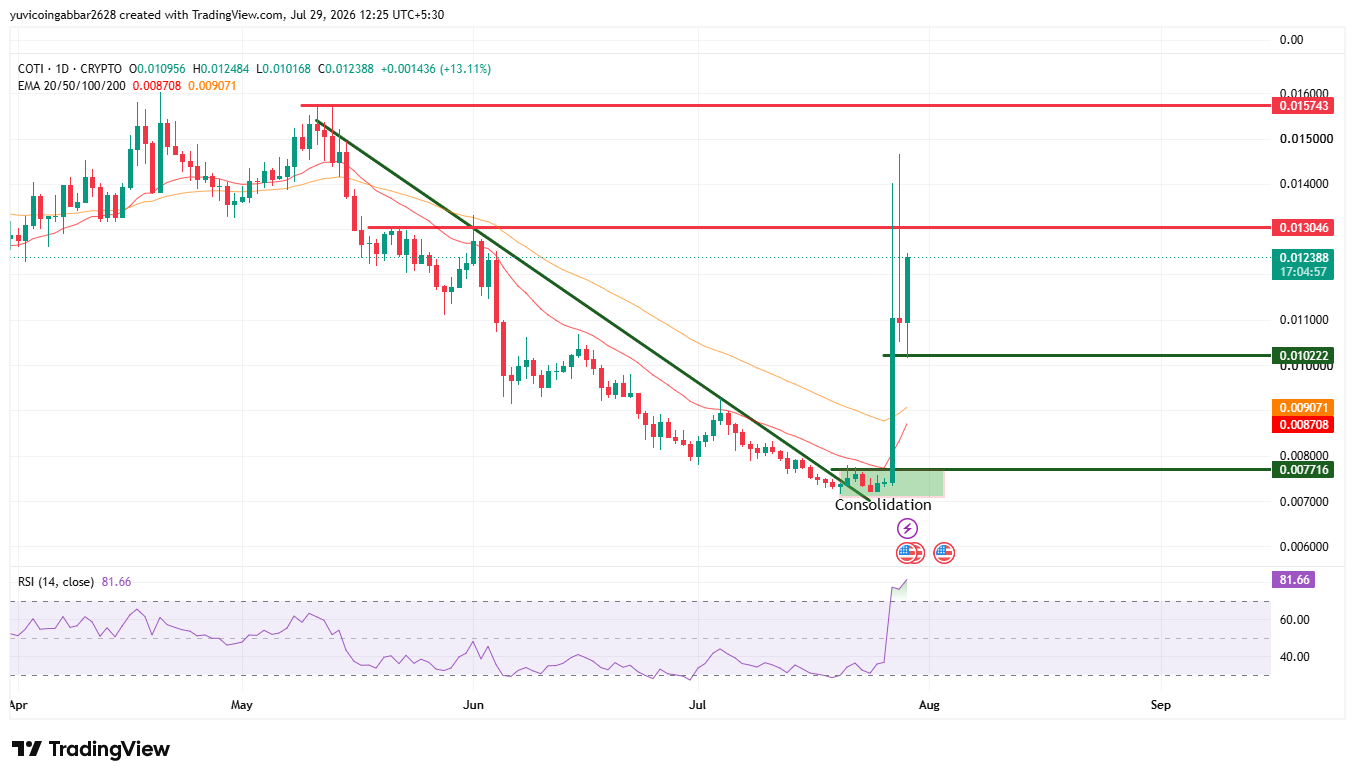
| Level Type | Price | Label |
| Resistance 2 (Stretch) | $0.015743 | Prior swing high |
| Resistance 1 | $0.013046 | Descending trendline zone |
| First Confirmed Support | $0.010222 | Breakout retest level |
| Deeper Support | $0.008708 | 20 EMA |
| Floor Support | $0.007716 | Consolidation-zone floor |
Bull Case vs. Bear Case
Bull case: If $COTI holds above short-term support at $0.011497 and the trendline, the next targets are $0.013061 and then $0.013953. A strong close above that zone could put the daily resistance at $0.015743 in play.
Bear case: A confirmed break back below $0.010764 would signal the breakout is failing, opening a retest of $0.010472 and, if that fails to hold, a slide toward the longer-term supports at $0.008708 and $0.007716.
Can $COTI Reach $0.015743?
It's possible but requires the breakout to hold first. $COTI would need to clear $0.013061 and $0.013953 with continued volume before the daily swing high at $0.015743 becomes realistic.
Given daily RSI is already at 81.66, this stretch target likely needs a cooling-off period rather than an immediate straight-line move.
What Happens If Support Breaks?
A confirmed break below $0.010764 is the clearest bearish signal on this setup. It would likely trigger a retest of $0.010472, and failure there would expose the deeper long-term supports at $0.008708 and $0.007716 levels $COTI spent weeks building a base around before this breakout.
Expert View
According to CoinGabbar analysts , the setup looks constructive but stretched. $COTI's breakout is backed by a genuine narrative and institutional-grade privacy tooling and confirmed by real price action reclaiming a multi-month downtrend line.
But daily RSI at 81.66 is a caution flag: parabolic first moves off a bottom often need to cool off before the next leg higher, and COTI's whale concentration (78.36% of market cap held by just 0.14% of wallets) means any profit-taking from large holders could accelerate a pullback faster than the chart alone suggests.
Disclaimer: This article is for informational purposes only and should not be treated as investment advice. Cryptocurrency markets are highly volatile, and readers should conduct their own research before making any financial decisions.









.jpg)








