Solana Price Prediction: SOL Holders Drop Before Major Governance Vote

Solana is trading near $74 this week. The price has held inside a narrow range since June, even as new data shows fewer wallets holding the token and record activity on the network at the same time.
These two signals point in different directions. That mix is worth a closer look before deciding what might come next.
What is the current Solana price today?
SOL sits around $74, based on data from KuCoin and other major exchanges. The token has moved sideways since early June, trading between roughly $65 and $85.
That range is far below the token's all-time high near $293, set in January 2025.
Why are Solana wallet numbers falling?
A chart from on-chain analytics account Ali Charts shows wallets holding at least 0.1 SOL dropped 5% in two weeks. That group fell from 11.84 million to 11.26 million.
This tracks small holders, not whales. A drop here can mean smaller investors are stepping back, moving funds to exchanges, or spreading holdings across new wallets.
It doesn't confirm large holders are selling too. Wallet count is one piece of the picture, not the whole story.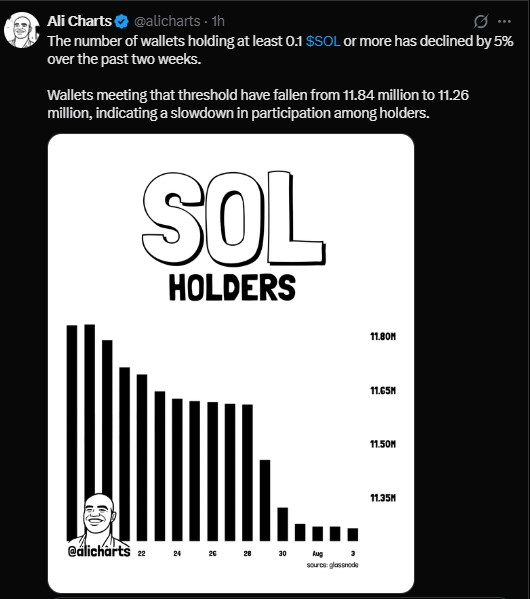
Is Solana network activity actually growing?
Yes, and this stands out. The network processed over 1.01 billion non-vote transactions last week, according to SolanaFloor. That's a new weekly record, beating the previous high from early July.
High transaction counts usually point to real usage, whether from trading bots, apps, or memecoin activity common on low-fee chains.
Rising activity alongside falling wallet counts is an unusual pair. It suggests existing users are doing more, even as fewer new wallets cross the 0.1 threshold.
What is the disinflation proposal and why does it matter?
A governance proposal to double the network's disinflation rate has cleared its first vote and entered discussion. It needs 65.16 million SOL in support, and it has already reached that bar, per SolanaFloor's tracker.
If the final vote passes, the change would cut future emissions by an estimated 18.9 million tokens over six years. At current prices, that's worth close to $1.39 billion.
Slower emissions generally mean slower supply growth. Tighter supply can support price over time if demand holds steady, though nothing here is guaranteed.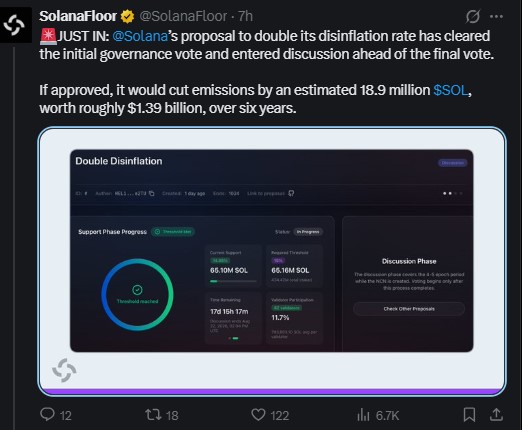
Price Data Snapshot
Metric | Value |
Current price | ~$74 |
2-week wallet change (0.1+ SOL) | -5% (11.84M to 11.26M) |
Weekly non-vote transactions | 1.01 billion (record) |
Proposed emission cut | 18.9M tokens over 6 years |
Estimated value of cut | ~$1.39 billion |
Governance support reached | 65.10M of 65.16M threshold |
All-time high | ~$293 (Jan 2025) |
What does the chart show right now?
The daily chart shows price inside a rising channel since June, following a sharp drop from levels above $140 in January. Price sits near the middle of that channel, close to the 20-day moving average around $74.60.
The 50-day average is near $75.57, and the 100-day average sits close to $78.86. Trading below these short-term lines suggests the bounce from June lows has lost some steam.
The 200-day average, far higher at $91.04, shows how much ground has been lost this year. A move back above $78 to $79 would be a first step toward that longer-term line.
Support in the channel sits near $70, a level tested more than once since late July. A break below on strong volume could open a deeper pullback.
What could move the price next?
Three things stand out for traders right now.
First, the outcome of the final disinflation vote. A pass could be read as a supply-tightening event, while rejection may disappoint traders who priced it in.
Second, whether transaction growth holds up. Continued record activity would support the case that real usage is climbing.
Third, whether wallet numbers stabilize or keep falling. A continued drop in small-holder wallets is worth watching, even without a clear price impact yet.
None of this guarantees a specific outcome. Markets react to on-chain data, broader crypto sentiment, and macro conditions like interest rates and risk appetite.
Disclaimer
This article is for informational purposes only and does not constitute financial, investment, or trading advice. Cryptocurrency prices are highly volatile, and past performance does not guarantee future results. Always do your own research and consult a licensed financial advisor before making investment decisions.


















