Cardano Price Prediction: Will ADA Bounce or Fall Next?


Cardano price prediction chatter is rising as ADA retests a key trendline.
Price has spent weeks climbing along this line, with buyers stepping in almost every time it comes back to test it.
After one retest sparked a sharp double-digit move higher, the setup is approaching that same structure again, this time showing signs of hesitation rather than an easy bounce.
Technical analysis prepared by CoinGabbar's crypto research desk. This piece is for informational purposes only and is not financial advice. CoinGabbar and the analyst do not hold a position in ADA at the time of publication.
The levels described here apply strictly to the 1-hour timeframe covered and should be rechecked if the price closes beyond the stated range.
Trend and Momentum: Key Takeaways
● The chart is holding an ascending trendline that has attracted buyers on nearly every retest.
● The third retest sparked an almost 12% upmove before the price pulled back to test the line again.
● Support from the 50 EMA extended that move further before the price turned back down to retest the trendline once more
● The chart has now broken below two EMAs and is showing rejection at the current retest
● A sustained close above $0.1999 could open the way toward $0.2322.
● A confirmed close below $0.1534 would invalidate the current bullish structure.
● Liquidations are mixed: short-heavy over the past hour, but long-heavy across the 4-hour and 24-hour windows.
ADA Price Right Now
Metric | Value |
Price | $0.1907 |
24h Change | -2.46% (-$0.00481) |
Market Cap | $6.96B |
Futures Volume (24h) | $565.94M |
Spot Volume (24h) | $112.44M |
Open Interest | $499.24M |
Circulating Supply | 36.50B ADA |
Total Supply | 44.99B ADA |
Max Supply | 45.00B ADA |
Open interest refers to the total value of derivative contracts still open across exchanges, a rough gauge of active leveraged positioning.
Chart source: 1-hour perpetual contract, TradingView, Binance data feed, captured August 5, 2026, around 12:02 PM IST. Market cap, volume, and supply figures from ADA market data on CoinGlass were captured the same day.
Cardano Price Prediction Methodology and Data Sources
This read uses the 1-hour chart on Binance via TradingView for price structure, with volume, open interest, and market cap figures from CoinGlass, and liquidation flow from CoinGlass's liquidation tracker.
All levels are treated as invalidated only on a confirmed candle close beyond the stated trigger, not an intraday wick. For a wider read on this same setup, see the latest ADA outlook.
Ecosystem Update: A $2.5M Pilot Fund for Builders
A fresh ecosystem update adds some fundamental context to this outlook.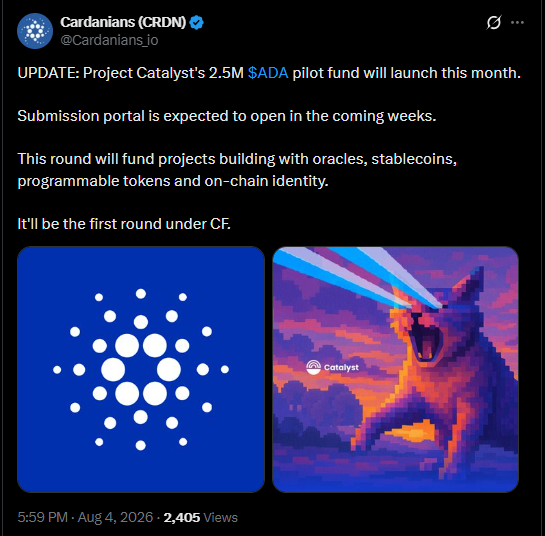
Cardanians confirmed that Project Catalyst's $2.5 million pilot fund is set to launch this month, with the submission portal expected to open in the coming weeks.
The round will fund projects built around oracles, stablecoins, programmable tokens, and on-chain identity, marking the first funding round run under the Foundation.
Ecosystem funding rounds like this rarely move price on their own, but they add to the broader development narrative building around the token, a theme also touched on in this staking anniversary breakout piece.
For now, this remains background context rather than a direct driver of the current trendline setup.
Source:, Cardanians (@Cardanians_io), X posted 5:59 PM IST, August 4, 2026.
Liquidation Snapshot
Liquidations show a mixed picture across timeframes.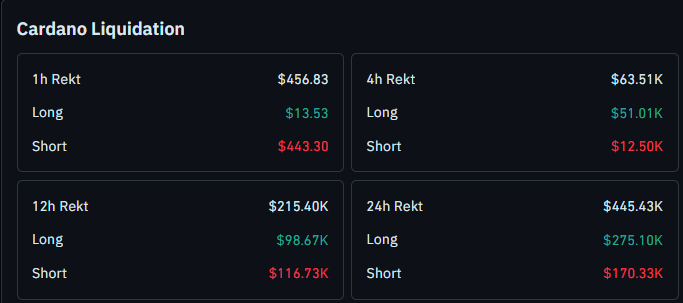
The 1-hour window recorded 443.30 against just 63.51K liquidated and longs, accounting for 215.40K, fairly split between 116.73K in shorts.
Across the full 24 hours, liquidations hit 275.10K of that total, a long-heavy skew that lines up with the pullback from the retest high, a pattern also covered in this breakout or breakdown analysis.
Source: ADA liquidation data, CoinGlass, checked August 5, 2026, around 12:02 PM IST.
Is This Trendline Retest Setting Up A Bounce Or A Breakdown?
Is this retest the setup for another leg higher, or is the trendline that has carried this entire move finally giving way? Right now the picture is mixed, and the current candle is doing the talking.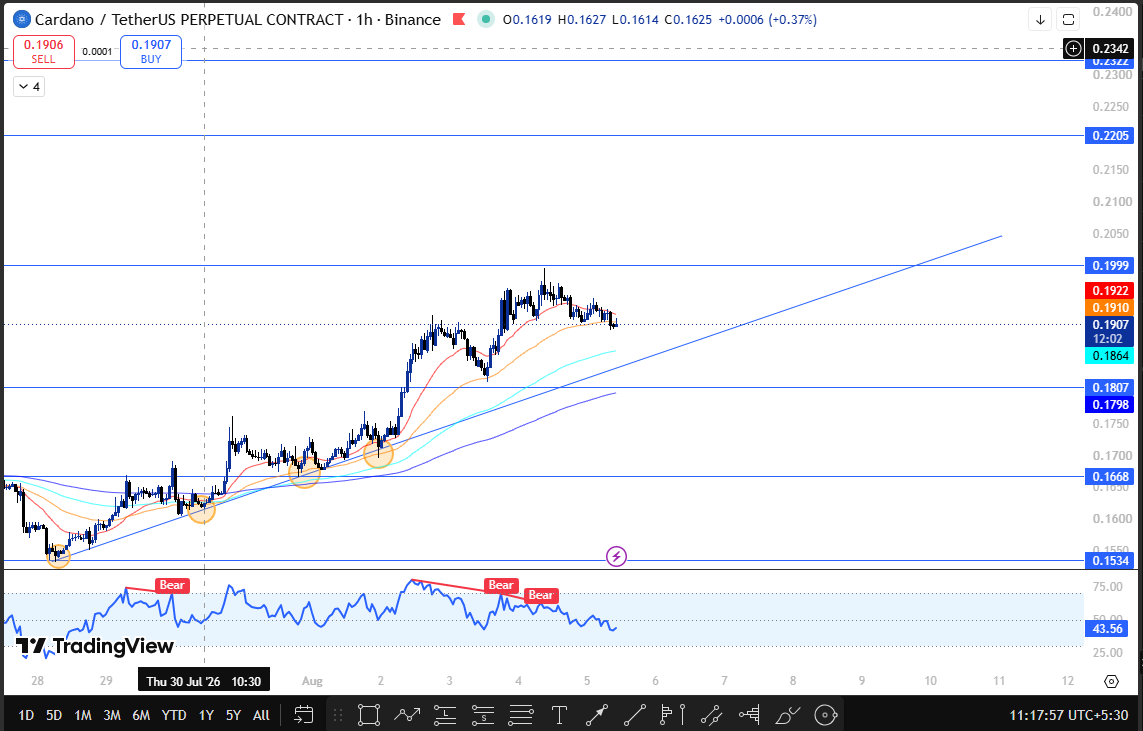
The chart has been following a well-defined ascending trendline for weeks, with buyers stepping in on nearly every test of that line.
The third such retest was the standout: the price broke away and ran almost 12% higher before cooling off, a rally also broken down in this bullish breakout coverage.
Rather than falling straight back to the trendline after that rally, price found support at its 50 EMA, extended the move a little further, and only then began drifting back down toward the ascending line for another test.
This time, though, the approach looks different. It has broken below two of the EMAs stacked just above the trendline, currently near $0.1910, and is showing early rejection at that cluster, a hesitation also flagged in this breakout confirmation setup.
Price is now trading just under this EMA cluster, with the next EMA support sitting near $0.1807 to $0.1864, and the next resistance sits at $0.2322.
If instead it breaks down and closes below 0.1534, a level that would need to hold to keep the broader uptrend structure intact.
The chart's momentum oscillator RSI, currently near 43.56, has already flagged two separate bearish divergence signals during this move, with price printing higher highs while the oscillator failed to confirm with equally higher highs of its own.
That kind of divergence does not guarantee a breakdown, but it does suggest momentum has been fading beneath the surface even as price kept climbing, a dynamic also discussed in this major breakout or crash setup.
Trend Prediction: Technical Outlook Snapshot
Indicator | Signal |
Trend | Respecting an ascending trendline, with buyers stepping in on nearly every retest |
Structure | Broke below two EMAs and is showing rejection at the current retest |
Momentum Oscillator RSI | Two bearish divergence signals were flagged during this move, with RSI near 43.56. |
Liquidations | Short-heavy on the 1-hour window, long-heavy on the 4-hour and 24-hour windows |
Support and Resistance Levels to Watch
Type | Level | Note | % From CMP |
Extended Resistance | $0.2322 | Reachable only after clearing $0.2205 | +21.76% |
Resistance 2 | $0.2205 | Second resistance on continuation | +15.63% |
Trigger Resistance | $0.1999 | Confirms continuation on a closing basis | +4.82% |
EMA Cluster | $0.1910 | Broken EMAs are now acting as resistance. | +0.16% to +0.79% |
Current Price | $0.1907 | Trading just below the EMA cluster | — |
EMA Support | $0.1864 | Next EMA support is below the current price. | -2.26% |
Trendline Zone | $0.1798 | Ascending trendline, prior support area | -5.25% to -5.72% |
Breakdown Trigger | $0.1668 | Invalidates the setup on a closing basis | -12.53% |
Support 1 | $0.1534 | Next support if $0.1668 fails | -19.56% |
Risk-Reward Table
Case | Trigger | Target |
Bull Case | Reclaims the EMA cluster and closes above $0.1999 | Move toward $0.2322. |
Bear Case | Closes below $0.1668 | Slide toward $0.1534 and lower. |
What Would Change This Cardano Price Prediction?
The setup stays undecided while price trades inside the $0.1999 range. A confirmed close above $0.2205, while a close below $0.1668 would suggest the trendline structure is breaking down, a scenario also weighed in this August 2026 outlook.
Given how sharp the prior 12% rally was, false moves in either direction are a real risk here, and leveraged positions near either trigger should account for that.
How Bitcoin Sentiment Could Influence This Move
This setup is built off the token's own chart, but Bitcoin still tends to set the tone for how far a move like this one can extend.
A steadier Bitcoin tape generally improves the odds of clearing $0.2205, while a weaker Bitcoin backdrop raises the risk of staying capped under the EMA cluster or sliding toward $0.1668.
When This Cardano Price Prediction Gets Revisited
This Cardano price prediction will be revisited on a confirmed close above $0.1668, or if no clear direction is confirmed within 24 hours of publication.
Glossary
Ascending Trendline: An upward-sloping line connecting successive higher lows, used to track support during an uptrend.
EMA (Exponential Moving Average): A moving average that weights recent price action more heavily, often used to gauge short-term trend direction.
RSI Divergence: When the price and the RSI indicator move in opposite directions, it often signals weakening momentum.
Liquidation: The forced closing of a leveraged position when a trader runs out of margin.
Open Interest: The total value of derivative contracts still open and unsettled.
Price Prediction: Bull, Base, and Bear Case
Bull Case: A confirmed close above $0.2205, then $0.2322, especially if broader sentiment and Bitcoin cooperate.
Base Case: Price keeps chopping around the EMA cluster and trendline zone without a decisive close in either direction.
Bear Case: A close below 0.1534, a scenario worth watching given the bearish RSI divergence already forming.
CoinGabbar's Technical Analyst View
The repeated trendline defense is the standout signal on this chart, with the same ascending line tested multiple times and one retest fueling an almost 12% rally. The current retest looks different, though, with price breaking below two EMAs and showing rejection rather than an immediate bounce.
If support holds here and the EMA cluster gets reclaimed, $0.2205 comes into view, with $0.1668 pointing to $0.1534 as the next support in this technical analysis.
Disclaimer
This Cardano price prediction is based on technical chart analysis and market data available at the time of writing. Cryptocurrency markets are highly volatile, and prices can change rapidly. This content is for informational purposes only and should not be considered financial advice. CoinGabbar and the analyst do not hold a position in ADA. Always do your own research and consult a qualified financial advisor before making any investment decisions.


















