Solana Price Prediction: SOL Breaks 9-Month Streak, Eyes $120

Solana is having a moment. After nine straight red months, $SOL just printed its first green monthly candle.
This Solana price prediction looks at whether the bounce can hold.
The token trades around $78, up nearly 38% from its cycle low of $60. That move alone added close to $14 billion back to Solana's market cap.
Is Solana's price going up or down right now?
Solana is in recovery mode, but it is not a straight line up. On the daily chart, SOL sits between $76 and $82, right in the middle of a rising wedge that has formed since early June.
The 20-day EMA is near $76.56, and the 50-day EMA sits at $76.67. Both are close to the current price, which shows a market still deciding on direction.
The 100-day EMA at $81.56 and 200-day EMA at $96.10 remain well above spot price. That stack of moving averages overhead is the main resistance zone bulls need to clear.
RSI is reading 54.09, which is neutral. There is room to move either way without the market being overbought or oversold.
Why is Solana's price moving today?
Network usage tells a stronger story than the chart. Solana just processed 1 billion weekly non-vote transactions for the first time ever, according to data shared by MSBIntel. That brings SOL's lifetime transaction count to 116 billion.
This kind of throughput growth, mostly fueled by meme coin launchpads and speculative trading, shows real demand for block space even while the token price lagged behind.
Money flow backs this up too. SoSoValue data showed a $1.67 million daily net inflow into Solana products, a small but positive signal after months of outflows.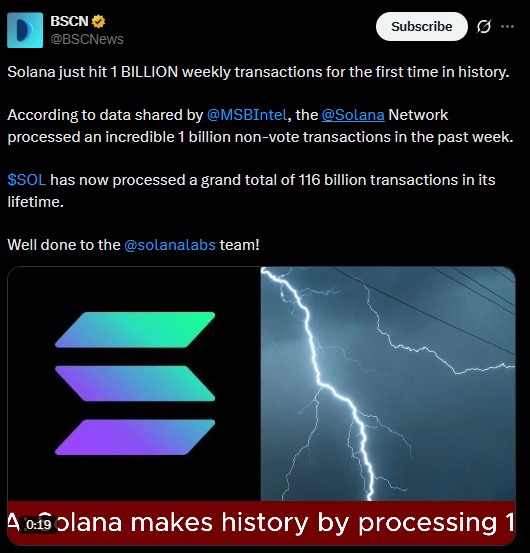
How much SOL is Pump.fun selling?
Not everything is bullish under the surface. Lookonchain data shows Pump.fun sold another 122,498 SOL, worth about $10.08 million, in a single day.
In total, Pump.fun has sold 4,656,826 SOL worth roughly $794.8 million at an average price of $170.70.
That is a steady stream of sell pressure coming from one source, and it is worth tracking as SOL tries to build a base.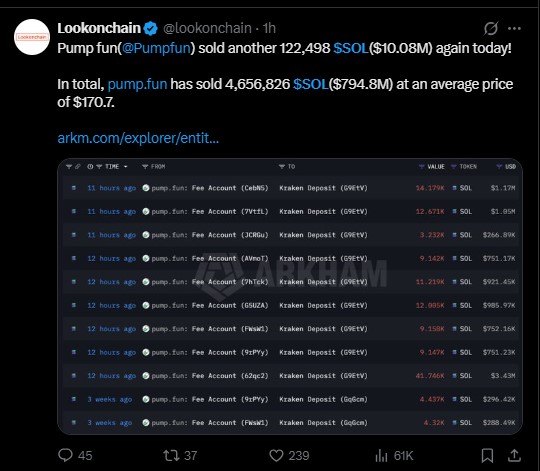
What do Solana futures and liquidation data show?
Metric | Value |
Spot price | $78.05 |
24h change | -4.22% |
Futures volume (24h) | $8.56B |
Open interest | $5.30B |
Market cap | $45.42B |
Long/Short ratio (24h) | 0.9417 |
Binance long/short (accounts) | 1.9403 |
24h Rekt (longs) | $15.27M |
24h Rekt (shorts) | $2.81M |
Open interest and long positioning remain heavy, and short-term long liquidations have outpaced shorts over the past day. That suggests some leveraged buyers got caught out during recent dips, even as the broader trend improves.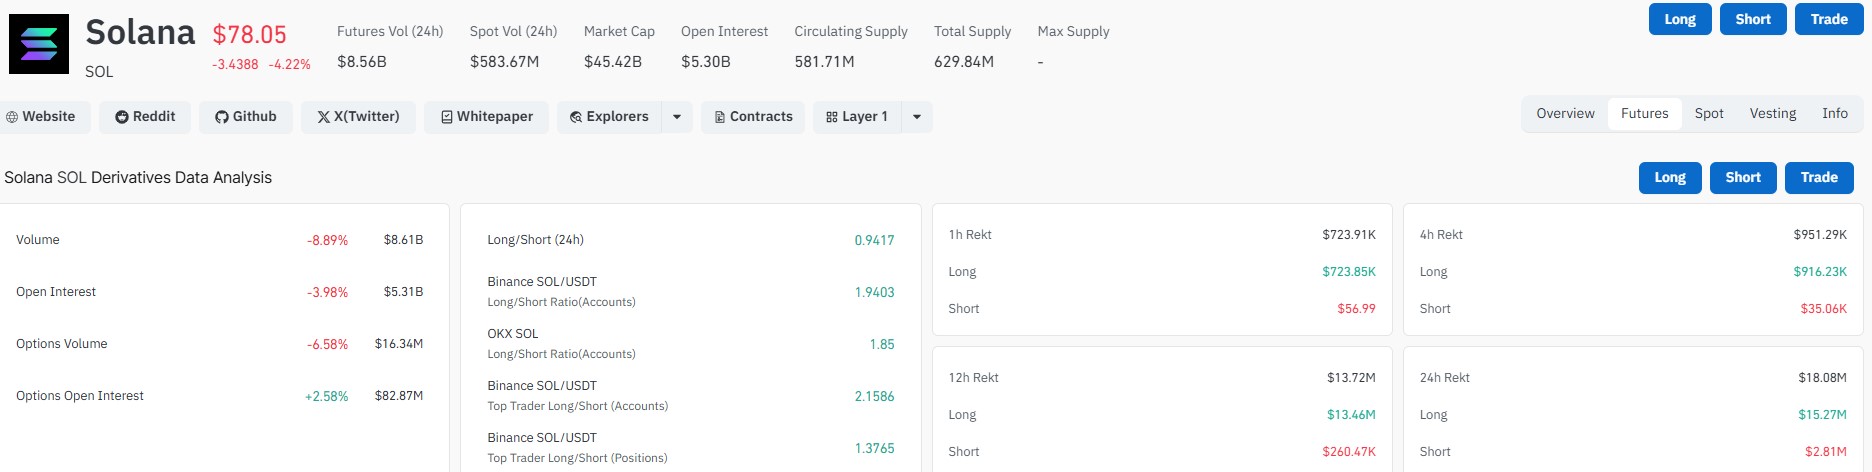
Solana Price Prediction: What is the next resistance level for SOL?
A daily close above $80 would be the first real proof that buyers are in control. That could open a path toward $97, where the 200-day EMA sits, and eventually the $120 area some analysts have flagged.
On the downside, the $60 to $65 zone remains the floor. A break below that would put the recovery story back in question.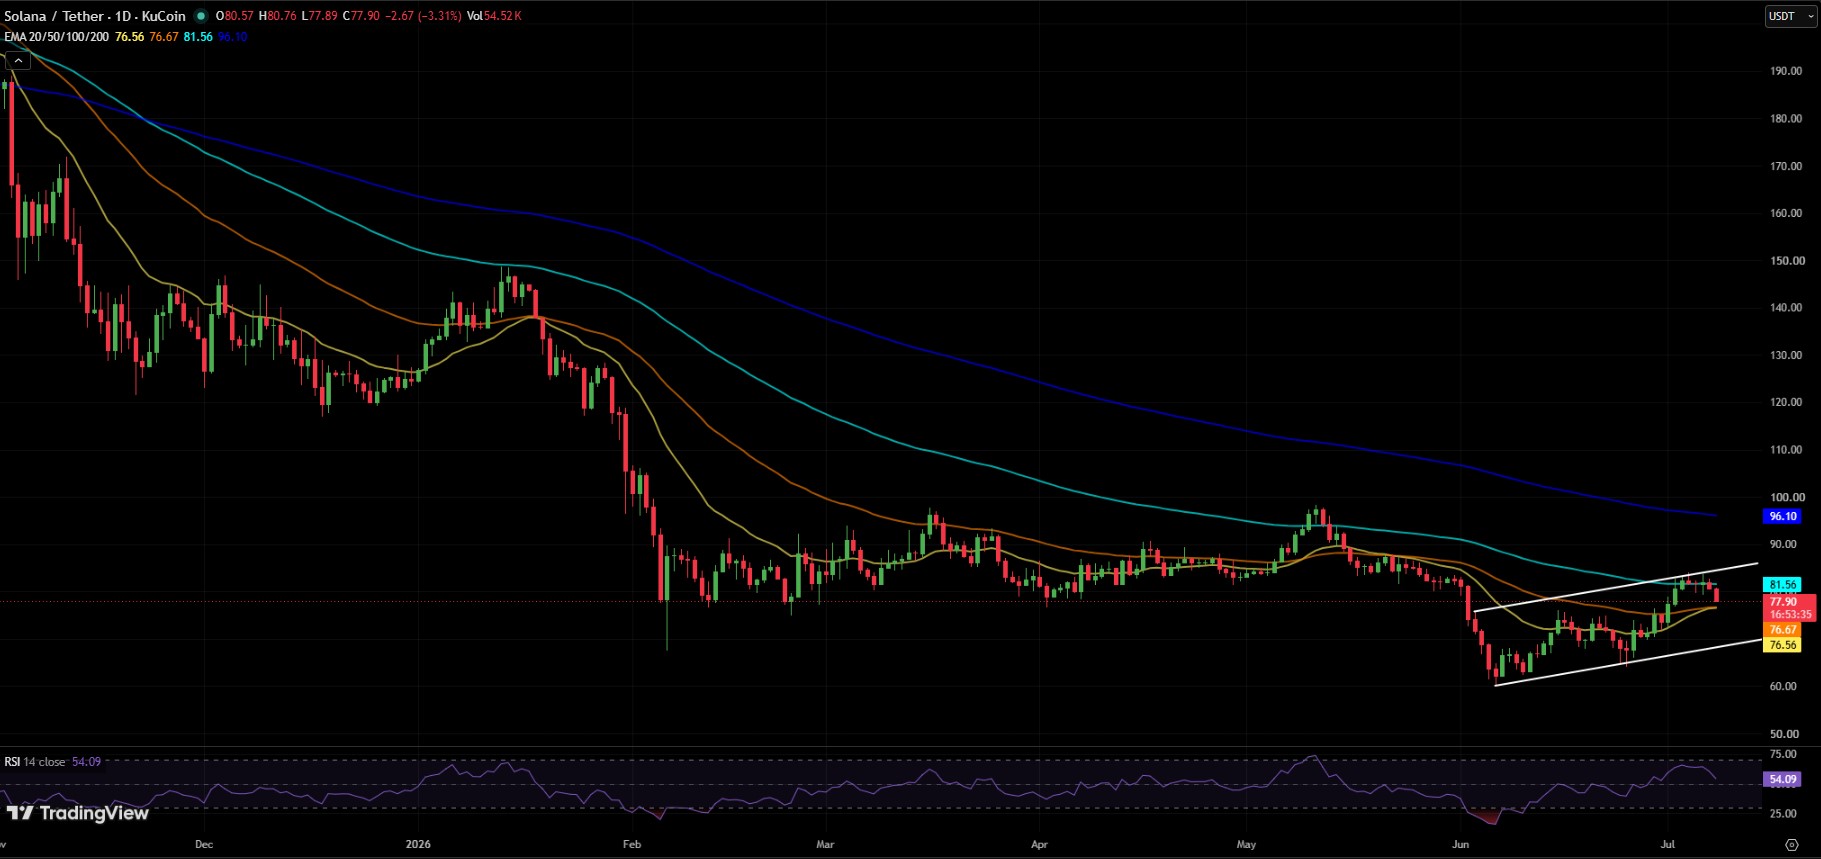
Nine months of losses is a heavy trend to reverse. One green month does not confirm a new bull run, but rising transaction counts and steady inflows give bulls something real to point to.
Disclaimer
This article is for informational purposes only and does not constitute financial, investment, or trading advice. Always do your own research and consult a licensed financial advisor before making any investment decisions.
Also read:
2 months ago
I just have to introduce this hacker that I have been working with him on getting my credit score been boosted across the Equifax, TransUnion and Experian report. He made a lot of good changes on my credit report by erasing all the past eviction, bad collections and DUI off my credit report history and also increased my FICO score above 876 across my three credit bureaus report you can contatc him for all kind of hacks, he helped my sister get all her stolen funds from a fraudulent cryptocurrency company . Email him here via EMAIL realcyberhackers @ gmail com orwhatsapp +14106350697

2 months ago
After being scammed out of $124,000 by an individual I met online through a fraudulent investment scheme, I sought legal assistance to recover my funds that i lost in crypto Thank God for my husband who told me about DAREK RECOVERY I contacted them on recoverydarek@ gmail. com and in less than 48 hours all my funds where recovered The company are very real and reliable in recovery funds back from scammers.











.webp)





