Starpower price forecast 2026: Can STAR Hold $0.12?


STAR just moved fast, and most people watching the chart did not see it coming until the candle had already closed. A quiet altcoin, sitting inside a boring range for weeks, suddenly woke up. Traders in group chats started asking the same question at the same time, and searches for Starpower price forecast spiked right along with the candle. Was this a real shift, or another short squeeze that fades by the weekend? What happened next is worth understanding before you make any decision.
What Made Traders Notice $STAR Today
Nobody was talking about Starpower a week ago. And then, out of nowhere, the order books started thinning out on the sell side.
Here's the thing: thin sell walls plus sudden demand equals a fast candle. That is exactly what happened.
We pulled up the live STAR order flow when the move started, and the first thing that stood out was how little volume it actually took to push price up. A market this small does not need much buying pressure to swing hard.
Key Takeaways
-
STAR trades near $0.1208, up roughly 25% in 24 hours as of August 17, 2026, 09:00 UTC.
-
The 4H chart shows STAR breaking out of an ascending channel with RSI at 77.59, deep into overbought territory.
-
Immediate support sits near $0.0969, with resistance building at $0.1289 and then $0.1801.
-
Whale wallets control over 70% of supply, and top 100 holders hold 74%, a real concentration risk.
-
Base case for the next 30 days points to $0.025 to $0.045, contingent on holding the weekly close above $0.0129.
For readers who want the deeper walkthrough on how these levels were built, the full breakout breakdown covers the chart step by step.
Where Is Starpower Price Right Now
STAR sits at $0.1208, up about 25% in the past 24 hours, based on the latest market snapshot captured around 09:00 UTC on August 17, 2026.
Market cap sits near $22.49M against a fully diluted valuation of $120.84M. That gap matters.
24-hour volume printed $4.49M, down nearly 26% even as the price climbed. Rising prices on falling volume are not the strongest signal, and the live STAR market data confirms that gap has not closed yet.
Why Is the Starpower Price Moving Today
There is no confirmed announcement, listing, or partnership tied to this move as of writing. That absence matters as much as any headline would.
But thin order books plus short liquidations often do the job on their own. Recent liquidation data shows $7.48K wiped out in 24 hours, and shorts took the bigger hit at $5.56K.
Squeezed shorts add fuel. They do not start fires on their own.
Turns out, low-liquidity altcoins move exactly like this when a handful of wallets decide to buy at once, and broader sentiment around Bitcoin price trends tends to set the mood for smaller names like this one too.
STAR Technical Chart Analysis: 4H and Weekly
4H Chart: Fast Breakout, Overheated Momentum
On the 4H chart , STAR broke clean out of an ascending channel that had held since late July. Price action stayed contained inside that rising structure for weeks, grinding sideways more than trending.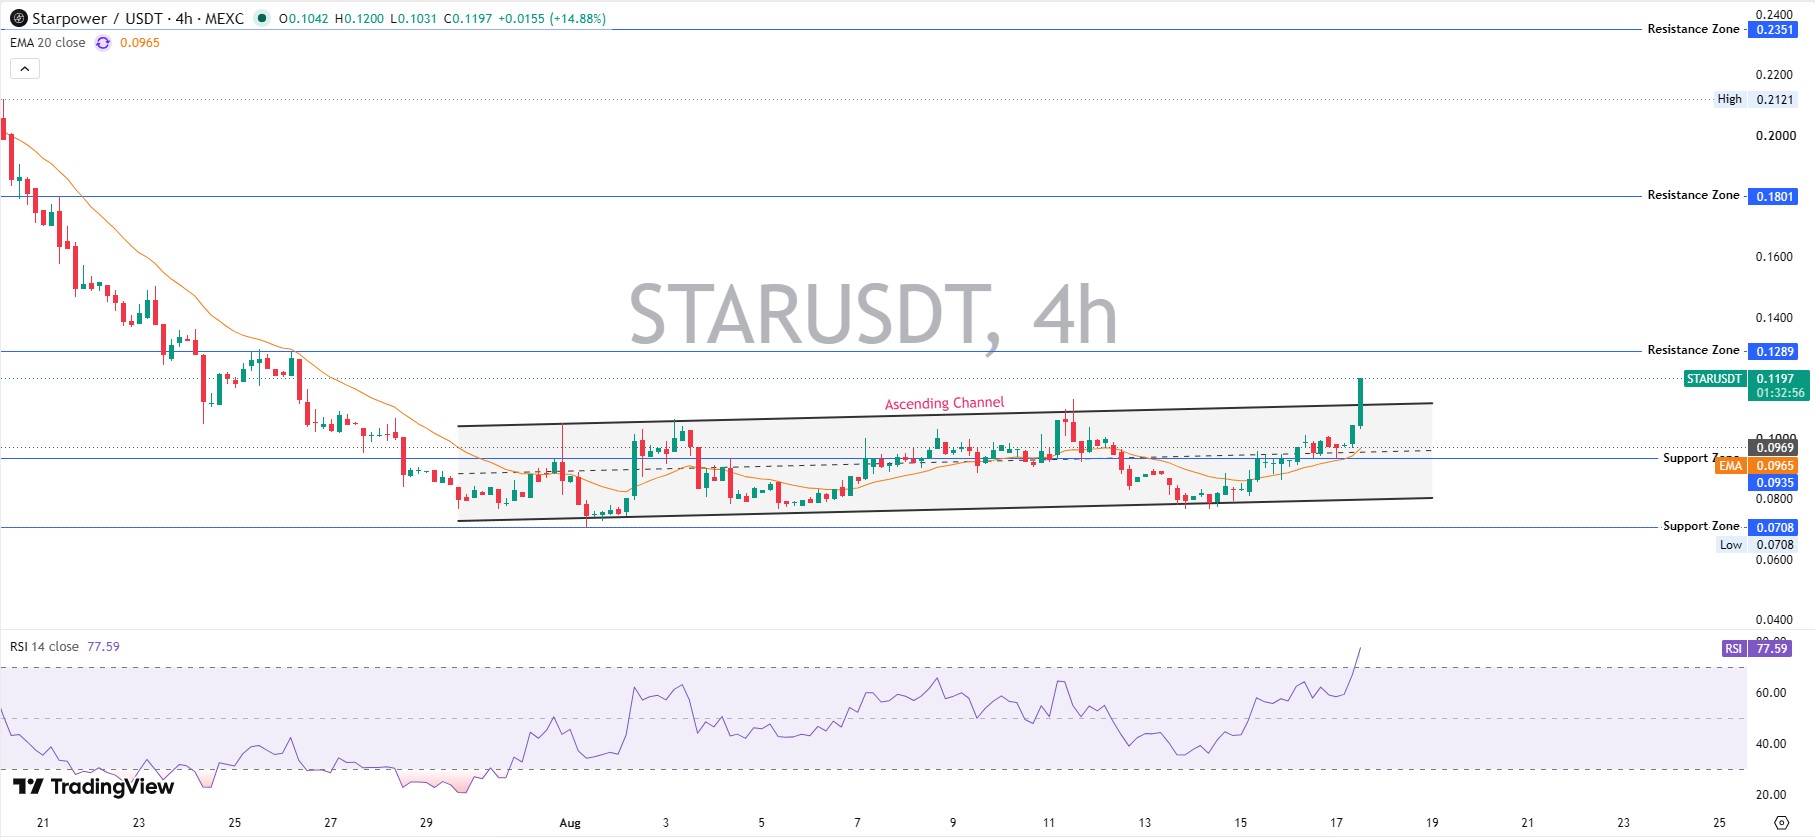
Then the breakout candle hit, and it hit hard. EMA20 sits at $0.0965, well below the current spot price near $0.1208, and that gap alone confirms the trend just accelerated rather than drifted.
RSI 14 reads 77.59, solidly overbought. Readings this high usually invite a pullback before any real continuation.
But "overbought" does not mean "over." It just means the next few candles carry more risk of a shakeout than the last few did. Traders watching this timeframe should expect chop, not a straight line higher. The breakout is real. Whether it holds is a separate question entirely.
Weekly Chart: Range Still Intact, Trend Not Confirmed
The weekly chart tells a different story, though. STAR has spent months inside a descending channel, and this week's candle is the first real push toward the upper boundary near $0.2058.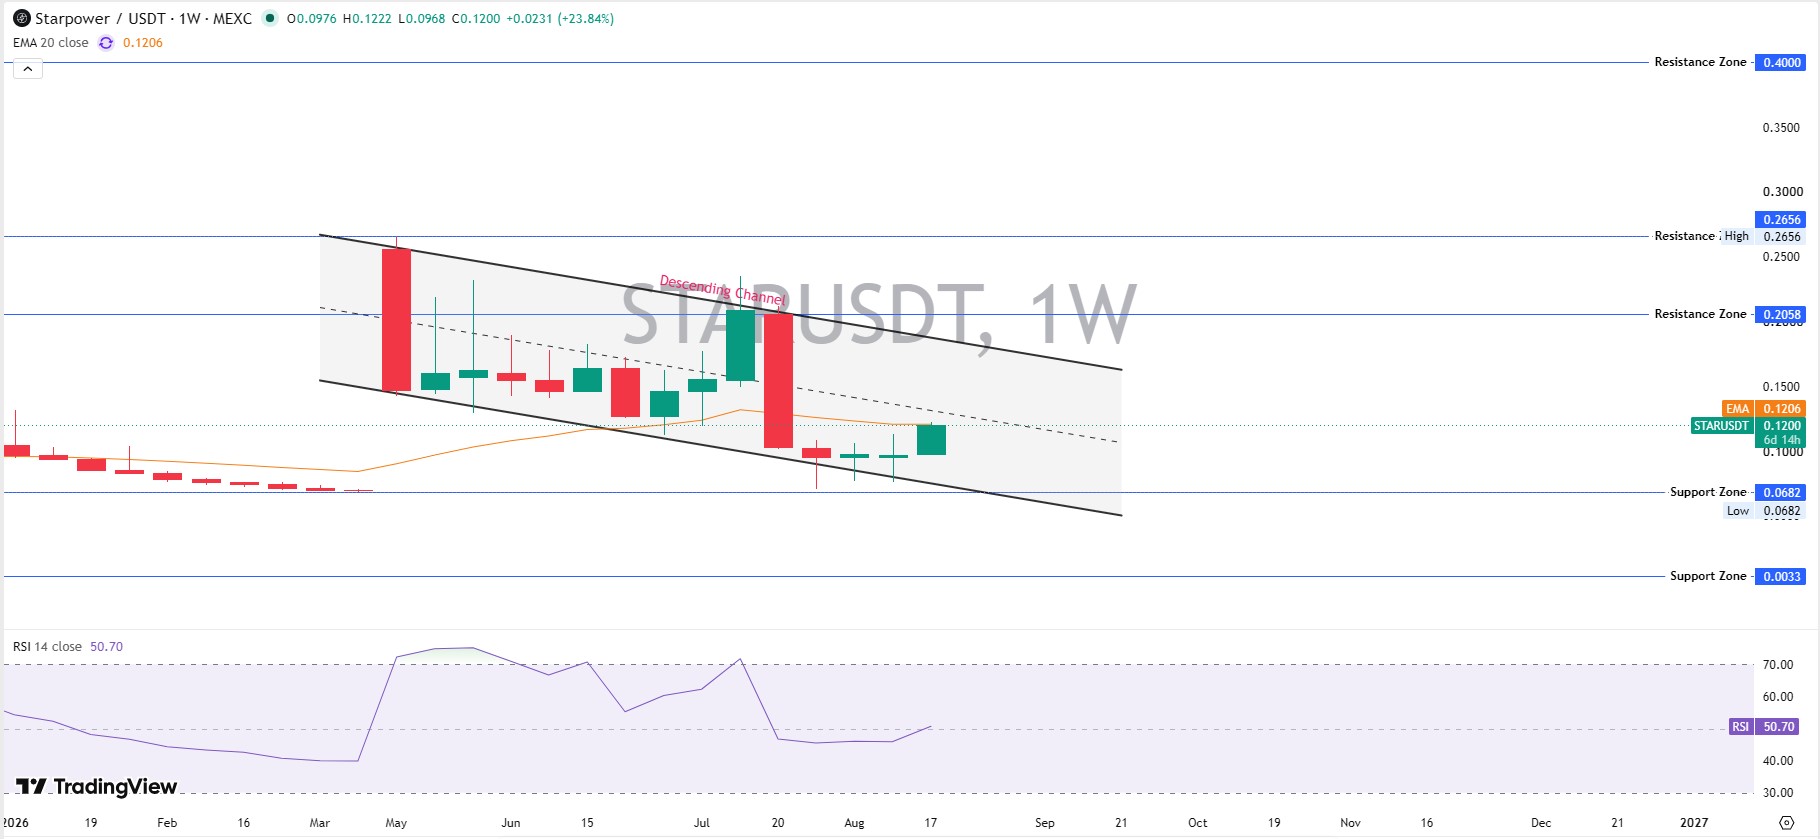
Weekly RSI sits at a neutral 50.70, nowhere near exhausted. That gap between an overheated 4H and a calm weekly is common right before volatility expands in either direction, and it means the bigger trend has not actually flipped yet.
Bulls want the weekly close to confirm above $0.1289. Bears want to see rejection at $0.1801, where heavy resistance has held twice already this year.
And until one of those levels breaks cleanly, this stays a range trade dressed up as a breakout. Wider market context, including Fed rate decisions, tends to shape how far altcoin breakouts like this one can run.
Support and Resistance Levels That Matter
Immediate support sits at $0.0969, matching the prior consolidation zone and the 4H EMA20 cluster near $0.0935.
Below that, $0.0708 is the harder floor, last tested in late July.
On the upside, $0.1289 caps the next leg, followed by a bigger wall at $0.1801 and then $0.2351. Traders comparing these levels against other small-cap setups often browse the price prediction hub for similar breakout patterns.
Tokenomics, Whales, and Liquidity
Here's something most trackers skip. Onchain data shows the top 100 wallets hold 74% of circulating supply, with a Gini score of 0.9314, one of the more concentrated distributions we have checked recently.
Fourteen wallets alone control over 1% of supply each. The largest labeled address is a Binance router proxy holding roughly 21.6%, which is exchange custody, not necessarily a single seller. Anyone who wants to verify this directly can check the STAR holder breakdown on-chain.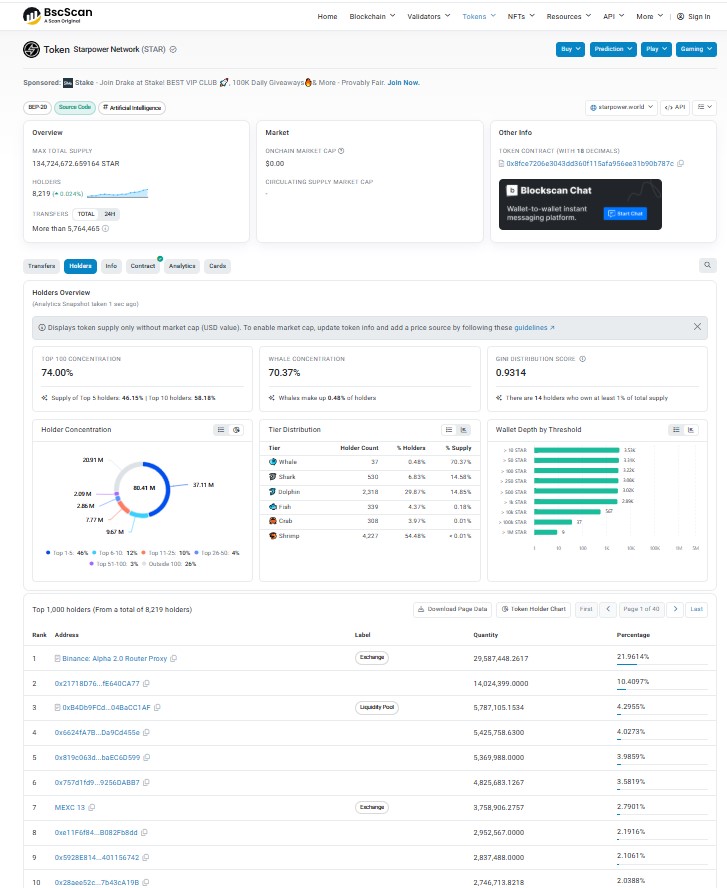
Investor tokens (15% of supply) unlock after a 12-month cliff, then vest linearly over 36 months. Team tokens (15%) carry a 24-month cliff before the same 36-month schedule kicks in.
Neither cliff has expired yet, which limits near-term unlock pressure. It's worth tracking future unlock dates on the crypto events calendar since that changes the supply picture fast.
Is STAR an Altcoin Worth Watching
Starpower is a small-cap altcoin built around distributed energy resources, not a memecoin riding hype alone. Readers curious how meme-driven tokens behave differently can compare them against recent memecoin market moves for contrast.
That distinction matters for this Starpower price forecast. Utility-linked altcoins tend to track adoption metrics slower but hold gains longer once real demand shows up.
For now, STAR still trades more on liquidity and sentiment than on fundamentals, which keeps it firmly in high-risk altcoin territory rather than a stable long-term hold. Projects tied to AI and energy infrastructure are covered in more depth in AI token coverage, which is a useful comparison set for STAR.
Starpower Price forecast: Bear, Base, and Bull Scenarios
| Timeframe | Bear Case | Base Case | Bull Case | Probability | Invalidation |
|---|---|---|---|---|---|
| 7 Days | $0.090–$0.100 | $0.115–$0.129 | $0.129–$0.180 | Bear 30% / Base 45% / Bull 25% | Daily close below $0.0969 |
| 30 Days | $0.070–$0.097 | $0.129–$0.180 | $0.180–$0.235 | Bear 30% / Base 45% / Bull 25% | Weekly close below $0.0708 |
| Early 2027 | $0.055–$0.070 | $0.180–$0.235 | $0.235–$0.300 | Bear 25% / Base 45% / Bull 30% | Sustained loss of $0.0708 support |
This Starpower price prediction leans base case. Not bullish denial, not bearish panic, just what the structure currently supports.
Risks Behind This Starpower Price forecast
Concentrated ownership is the biggest one. When 14 wallets hold over 1% each, a coordinated exit can crush price fast.
Thin volume is the second. $4.49M in daily turnover against a $120M FDV leaves little room for large orders without slippage.
And overbought RSI on the 4H chart raises the odds of a short-term cooldown even if the weekly trend stays intact. New exchange listings can shift that liquidity picture quickly too, so it's worth watching the exchange listing calendar for anything tied to STAR.
Glossary
-
RSI (Relative Strength Index) measures how fast and how far price has moved, with readings above 70 flagged as overbought.
-
EMA (Exponential Moving Average) weights recent prices more heavily than older ones.
-
FDV (Fully Diluted Valuation) values every token that will ever exist, not just the circulating supply.
The Gini score measures wealth concentration, where scores closer to 1 mean fewer wallets hold most of the supply. For more terms and daily coverage, the latest crypto news section breaks down similar jargon regularly.
Regulatory shifts also move small-cap altcoins like STAR, and the crypto regulation bill currently moving through the Senate is one to watch. Airdrops tied to energy and infrastructure tokens are also tracked on the crypto airdrops page, which is useful context for anyone holding STAR long-term.
Disclaimer
This article is for informational purposes only and does not constitute financial, investment, or trading advice. Cryptocurrency prices are highly volatile, and past performance does not guarantee future results. Always do your own research and consult a licensed financial advisor before making any investment decisions.
Also read:













.webp)








