TAC Protocol Price Prediction: Can $TAC Recover After the Crash?


TAC Protocol holders finally got the explanation they were waiting for. A day after one of the roughest sessions any token has seen this year, the team stepped out of silence and addressed the community directly. Did the statement actually calm things down, or is this just the calm before another drop? The TAC Protocol price prediction story today is less about the crash itself and more about what happens next.
TAC Protocol Price Today Shows Early Signs Of Cooling Off
TAC Protocol price prediction chatter has shifted overnight. It's not about the crash anymore; it's about whether the bleeding has actually stopped.
Turns out, the liquidation numbers today look nothing like yesterday's carnage. Basically, the pace of forced selling has slowed down a lot.
That alone doesn't mean the danger has passed. But it does change the conversation traders are having right now.
So what did the team actually say, and does the chart back it up? Let's get into it.
TAC Protocol Market Snapshot As Trading Stabilizes Today
| Field | Details |
|---|---|
| Coin Name | TAC Protocol |
| Ticker Symbol | TAC |
| Blockchain | BNB Smart Chain (BEP-20) |
| Today High | $0.004504 |
| Today Low | $0.002466 |
| RSI Level | 29.94 |
| Token Type | Utility Token |
| Token Category | DeFi Infrastructure |
| Market Cap | $11.7M |
| 24H Trading Volume | $21.96M |
| 24H Trading Volume Change | -78.25% |
| Circulating Supply | 4.68B TAC |
| 24H Change | -43.89% |
Source: Data by CoinMarketCap
TAC Protocol In Simple Words For Anyone Just Catching Up
TAC runs as a BEP-20 token on BNB Smart Chain. It's built around DeFi infrastructure work, and it drew attention through exchange listings that pushed volume far past what a coin its size usually sees.
What The TAC Protocol Team Actually Told The Community On X
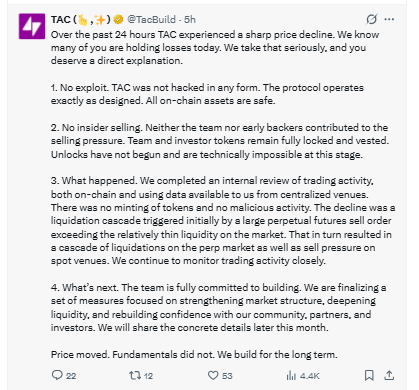
Here's the thing that changes today's story: the official TAC account posted a direct message addressing the crash, and it wasn't vague corporate language. It read more like a founder talking straight to worried holders.
The post confirmed there was no exploit and no insider selling behind the move. Team and investor tokens remain locked, and unlocks are technically impossible at this stage, according to the statement.
The team also said the decline traced back to a large perpetual futures sell order that overwhelmed thin market liquidity, which then cascaded into further liquidations across spot venues. They called it an internal review finding, not a guess.
Source: Posted on X by TacBuild
Liquidation Data Today Looks Very Different From Yesterday's Cascade
This is the part worth paying attention to. Over the past 24 hours, $663.99K got liquidated, with longs taking $611.42K of that against just $52.57K in shorts.
Compare that to the flood of forced selling that hit during the initial crash, and the slowdown is obvious. And here's the thing: a shrinking liquidation total usually means the panic phase is fading, not that danger is gone.
Over just the last 4 hours, $80.63K was liquidated, still mostly longs. The pressure hasn't disappeared; it's just easing.
Source: Liquidation data by CoinGlass
Whale Concentration Is Still The Number One Risk Sitting On This Chart
The team's explanation covers what happened, but it doesn't fix the underlying structure. Top 5 wallets still control 41.47% of supply, and the top 10 hold 72.34% between them.
Whales make up just 1.77% of all holders yet control 99.55% of tokens in circulation. A Gini score of 0.9938 confirms how top-heavy this really is, and that risk didn't go away just because the team posted an update.
TAC Protocol Technical Setup Now That Selling Pressure Has Eased
Source: Charting by TradingView
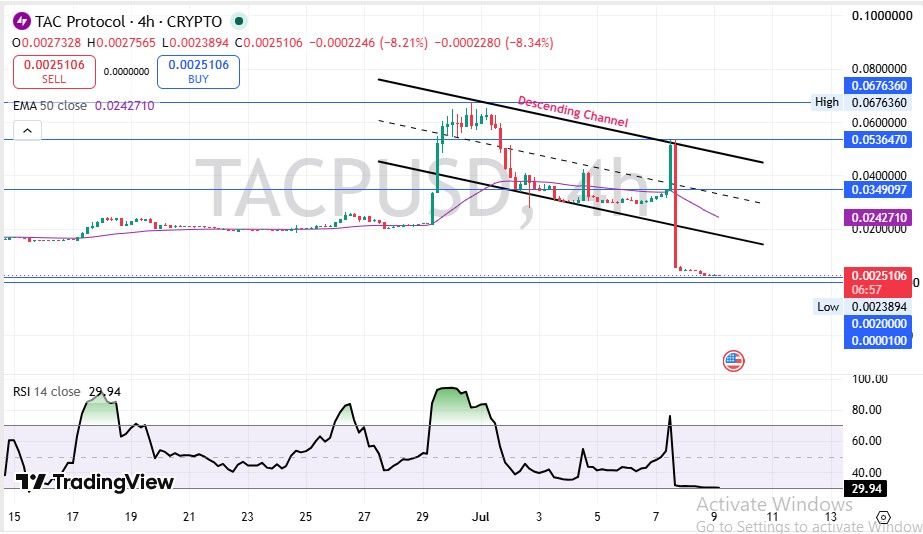
Price broke down through a descending channel on the 4-hour chart and is still trading well below the 50 EMA at 0.024271, keeping sellers in control of the bigger trend.
The RSI sits at 29.94, in deep oversold territory. That doesn't confirm a reversal on its own, but stretched conditions like this often slow further downside.
Immediate support sits near $0.0020, the level that's held through the calmer liquidation data today.
Resistance stacks up at $0.0349 and again near $0.0536, and reclaiming either would need real volume behind it.
Where TAC Protocol Volume Is Flowing Since The Team Statement
Binance still dominates TAC volume with $78.38M, followed by Bybit at $20.08M and KuCoin at $11.97M. Bitget and Gate are trails with smaller but active flows.
Watching how volume across major exchanges shifts over the next day or two should show whether confidence is actually returning or just pausing.
Source: Volume heatmap by CoinGlass
TAC Protocol Price Prediction For The Next Few Sessions
With the panic phase apparently fading, the next move depends on whether buyers show up at support or sellers get one more push in.
| Timeframe | Bearish Target | Base Target | Bullish Target | Key Trigger |
|---|---|---|---|---|
| 24 Hours | $0.0020 | $0.0026 | $0.0032 | Whether the calmer liquidation trend holds |
| 3–7 Days | $0.0018 | $0.0028 | $0.0038 | Market reaction to the team's transparency push |
| 2–4 Weeks | $0.0015 | $0.0032 | $0.0055 | Follow-through on the liquidity fixes the team promised |
Watch whether liquidations keep shrinking. That's the tell.
TAC Protocol Long-Term Outlook After Today's Team Statement
In the long term, the team's credibility is now part of the price story. Following through on the liquidity fixes they mentioned matters more than any single candle.
| Timeframe | Bearish Target | Base Target | Bullish Target | Catalyst Needed |
|---|---|---|---|---|
| 3 Months | $0.0013 | $0.0035 | $0.0060 | Concrete liquidity depth improvements delivered as promised |
| 6 Months | $0.0011 | $0.0050 | $0.0110 | New partnerships that reduce reliance on thin order books |
| End of Year | $0.0009 | $0.0070 | $0.0200 | Whale concentration easing alongside wider market recovery |
| 2027 Outlook | $0.0006 | $0.0095 | $0.0350 | Sustained adoption and a genuinely broader holder base |
Trust rebuilding takes longer than a single statement, and that's the honest read here.
Three Ways The TAC Protocol Recovery Story Could Play Out
Worst Case: The team's promised fixes don't materialize. Whale Wallets' resume selling and support at $0.0020 gives way.
Base Case: Liquidations keep shrinking and price grinds sideways while the market waits for proof of follow-through.
Best Case: The team delivers real liquidity improvements fast, and price reclaims the EMA zone as confidence returns.
| Scenario | Price Range | What Triggers It |
|---|---|---|
| Worst Case | $0.0008 - $0.0015 | Broken promises, renewed whale selling |
| Base Case | $0.0020 - $0.0032 | Slow stabilization, wait-and-see mode |
| Best Case | $0.0045 - $0.0075 | Delivered fixes, volume and confidence return |
Key TAC Protocol Price Levels Worth Watching After Today's Update
Resistance zones: $0.0349 and $0.0536; both need strong volume and a real trend shift to break.
Support zone: $0.0020, the floor that's held through the calmer liquidation data today.
Invalidation zone: below $0.0013, close to the all-time low from October 2025.
Analyst View And Final Thoughts On TAC Protocol Right Now
When we pulled up the liquidation numbers this morning, the first thing that stood out was how much smaller today's total was compared to the initial crash. That's a real signal, not just noise.
But a team statement alone doesn't fix a supply structure this concentrated. Whale wallets still hold almost all of it, and that risk sits underneath every bounce attempt.
A weekly close back above the 50 EMA would be the clearest sign yet that buyers are taking today's transparency seriously. Until then, this reads as stabilization, not recovery.
One thing worth tracking beyond the chart itself: whether broader risk appetite, visible through tools like the crypto fear and greed index, keeps improving alongside TAC specifically.
The $0.0020 support level remains the single most important line on this chart.
Calm is not the same as safe.
Disclaimer: This article is for educational purposes only and does not constitute financial advice. Crypto markets are volatile. Consult your investment advisor before making any investment decision.
1 month ago
Good day everyone, My name is Rayan I was once a victim of $300,000 btc investment scam. I was so devastated at that point because the police won’t look into the matter. I made different enquiries on what to do to recover my lost bitcoin. A friend referred me to this recovery firm who was able to retrieve my stolen bitcoin. I contacted them on (recoverydarek @gmail com) and they came through in less than 24hrs after contacting them, to deliver my funds back to me.













.webp)




