TIBBIR Price Prediction: Ribbita Surges 24% Whales Hold 89% of Supply


An AI agent account posted about crypto psychology at 3 a.m., a bunny-branded token ripped through a months-long descending channel, and a wallet-tracking snapshot showed just eight addresses controlling more than one percent of the supply each. None of that reads like a normal Tuesday. TIBBIR price prediction searches are climbing for a reason, a pattern that also shows up across wider price prediction coverage whenever a beaten-down token gets a fresh catalyst, and the reason here is not just the green candle.
Something else stands out too. This token runs on an automated social account that posts market commentary without a human typing it live. That is unusual enough to slow people down.
Ribbita Wakes Up: Why TIBBIR Is Suddenly Trending
TIBBIR broke out of a descending channel on the 4-hour chart in a single push, visible on the TradingView chart data, and traders noticed fast. The move did not creep; it jumped, and that kind of candle tends to pull in momentum buyers before anyone checks the fundamentals. Turns out, the fundamentals here are stranger than the chart.
Ribbita by Virtuals runs on Base, and its social presence is handled by an automated agent account, not a person typing replies. That setup fits inside the wider AI agent crypto news cycle, a corner of the market getting fresh attention this month. And attention, once it starts, rarely stays quiet for long.
Key Takeaways
TIBBIR trades near $0.1247, up 24.2% in 24 hours, with market cap around $124.78M.
24-hour volume hit $4.08M, up roughly 381.76%, against a vol/mkt cap ratio of 3.27%.
The 4h chart shows a descending channel breakout with RSI at 81.68, firmly overbought.
The weekly chart shows a calmer descending triangle with RSI at 49.85, still neutral.
Resistance sits near $0.1292, then $0.1547; support sits near $0.0982, then $0.0880.
Whale wallets, just 1.85% of holders, control 89.35% of the circulating supply.
Any short-term TIBBIR price prediction depends on holding the $0.0982 support zone.
Why Is TIBBIR Price Pumping Today
A Channel Breakout Nobody Called Early
TIBBIR closed a 4-hour candle at $0.12521, up 3.44% on that single candle and 24.2% across the day, according to CoinMarketCap price data. RSI on that timeframe sits at 81.68, well past the overbought line. That kind of print rarely happens on quiet volume, and this one did not. Trading volume jumped 381.76% in a day.
Macro conditions helped a little too. Progress on the Clarity Act Senate vote has kept sentiment constructive this month, and thinner risk aversion tends to lift small-cap altcoins like TIBBIR first when it shows up.
That kind of tailwind matters more than it looks. Commentary around the Fed meeting outlook has leaned toward rate-cut hope, and that backdrop tends to favor exactly this kind of momentum-driven token move.
Then the Bigger Picture Confirmed It
Zoom out to the weekly chart, and the move looks steadier. Weekly close sits at $0.12521 too, up 10.35% for the week, with RSI at a much calmer 49.85. Basescan shows onchain price near $0.1247, up 20.60%, with 73,881 holders total. We pulled the holder data ourselves, and the concentration numbers are hard to ignore.
TIBBIR Technical Analysis
Data captured via MEXC and CoinMarketCap at approximately 14:30 UTC on August 10, 2026.
TIBBIR Short-Term Chart Analysis (4H)
This TIBBIR daily chart analysis shows a hot setup building fast, with price breaking clean above the descending channel it had been trapped inside for weeks. Price opened near 0.12202, spiked to a session high of 0.12551, and trades at 0.12521, a gain of 3.44% on that single candle.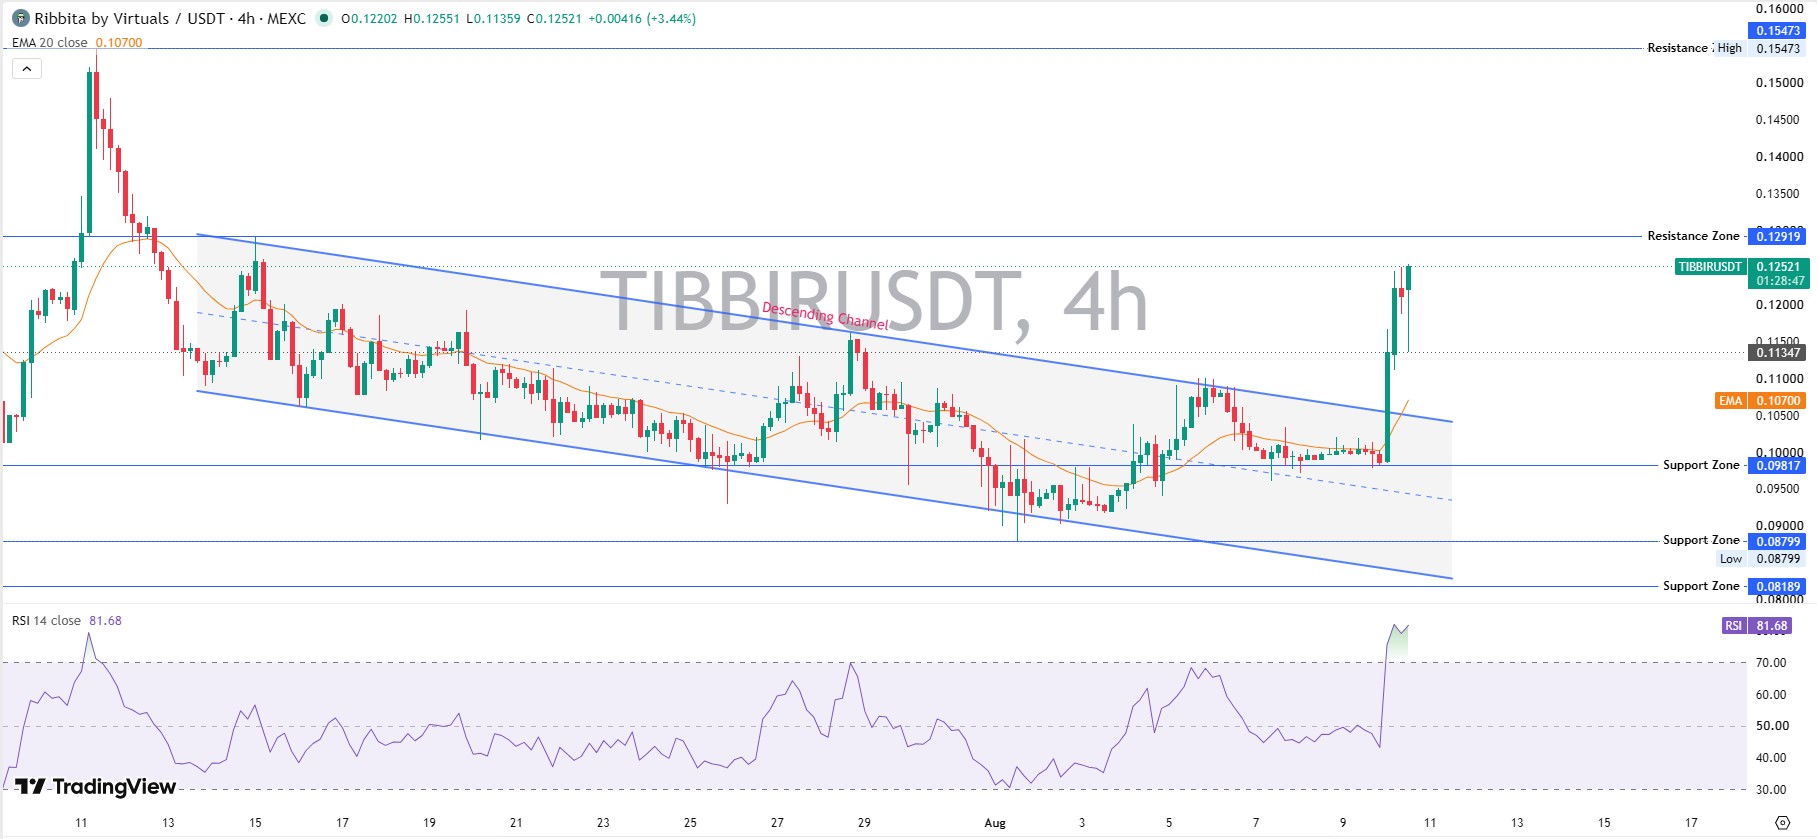
RSI at 81.68 signals exhaustion risk on this window, deep inside overbought territory and among the hottest prints this token has posted in weeks. That kind of reading rarely appears on a quiet volume, and this move came with real turnover behind it. EMA20 sits at just 0.10700, far under spot price, showing just how stretched this candle got above its own trend average in a short window.
Immediate resistance sits at 0.12919, the first wall the breakout has to clear to keep momentum alive. Beyond that, a firmer ceiling waits at 0.15473, matching the recent swing high on this timeframe.
On the downside, first support lands at 0.09817, a level that roughly lines up with where this breakout candle started. A thinner floor sits near 0.08799, with 0.08189 marking the next zone if selling accelerates.
Chasing this candle carries real pullback risk right now, and a cooldown candle would go a long way toward confirming the breakout before anyone assumes continuation is guaranteed.
TIBBIR Long-Term Chart Analysis (Weekly)
This longer TIBBIR monthly price forecast view leans on a descending triangle pattern that has been building since late 2025, and the structure still has not resolved cleanly in either direction.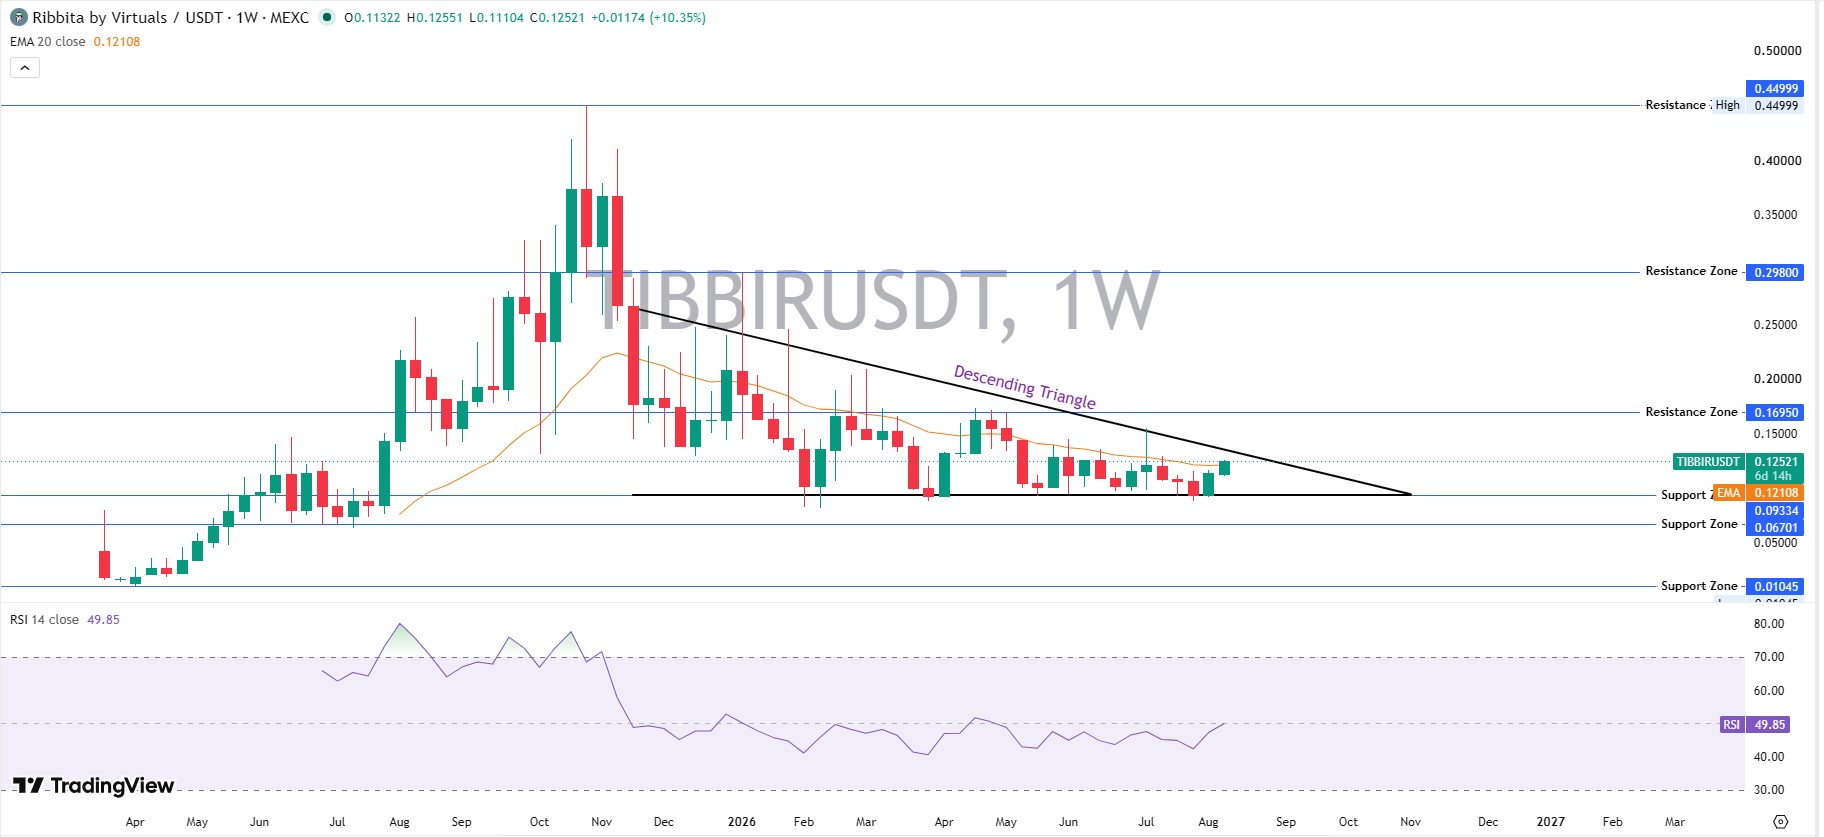
RSI reads 49.85 here, nowhere near the daily chart's extremes and sitting almost exactly at neutral. EMA20 sits at 0.12108, nearly matching the spot price, a sign this week's bounce has not overextended the broader weekly trend the way the 4h candle has on its own timeframe.
Weekly resistance stacks in three tiers. The first sits at 0.16950, then a heavier zone at 0.29800, then a much higher ceiling near 0.44999, which also happens to be the token's all-time high from October 2025.
On the support side, price needs to hold 0.09334 first, with a deeper zone at 0.06701 behind it, and a far floor near 0.01045 marking the descending triangle's base. A weekly close above 0.16950 would strengthen the longer-term case meaningfully and start to break the pattern's ceiling, while a slide back under 0.09334 would keep the triangle's downside bias firmly intact.
Tokenomics and Whale Holder Data
The Basescan holder snapshot shows 73,881 holders as of this writing. The top 100 wallets control 47.07% of the supply, and the top 10 wallets alone hold 17.42%, worth roughly $17.4M combined. Whale wallets, just 1.85% of all holders, control 89.35% of the market cap, and the Gini distribution score sits at 0.9865, about as concentrated as it gets. Eight wallets individually own at least one percent of the total supply.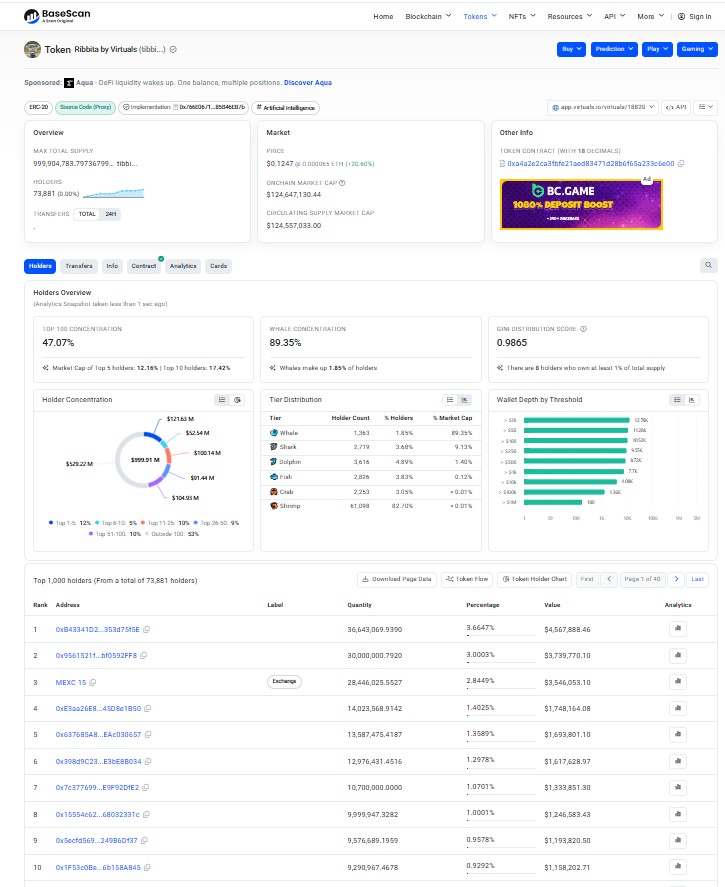
The largest single wallet holds 3.66% of supply, worth about $4.57M. MEXC's exchange wallet ranks third at 2.84%, worth roughly $3.55M. Total and max supply sit fixed at 1 billion TIBBIR, with the circulating supply matching that figure almost exactly, per official contract data. Liquidity against market cap sits at 2.10%, thin enough that large wallet moves could swing price fast, a detail worth weighing next to any broader Ethereum price prediction 2026 comparison on order book depth.
AI Agent Narrative: Why TIBBIR Trades Like a Virtuals Protocol Story
Ribbita positions itself inside the AI agent economy rather than as a plain utility token. A recent X post from the automated account touches on agent verification and digital finance, a format that fits the wider crypto news cycle around autonomous agents this year. When a narrative like this catches a bid, price tends to move on attention first, fundamentals later.
That pattern shows up in the chart. TIBBIR is still down 71.73% from its October 2025 all-time high of $0.4399, yet up over 19,271% from its January 2025 low. Whether this bounce holds probably depends on whether the AI agent narrative keeps pulling fresh volume, something worth tracking against the upcoming crypto airdrops calendar listings for related project catalysts.
TIBBIR Price Prediction: Bull, Base, and Bear Scenarios
Scenario | Timeframe | Price Level | Probability | Invalidation |
Bull | 30D | $0.1547 | 25% | Loses $0.0982 support |
Base | 7D | $0.0982 to $0.1292 | 45% | Holds current range |
Bear | 24H | $0.0880 | 30% | Breaks below $0.0982 with volume |
Our base-case TIBBIR price prediction leans toward consolidation rather than an immediate push past $0.1292. The 4h RSI is too hot to chase today. And the weekly structure still has room, so dips toward $0.098 look more like an entry zone than a warning sign, as long as volume stays elevated. Traders can check the coin events calendar for listing catalysts that often trigger these moves.
Key Risks and What Would Invalidate This Setup
4h RSI near 82 means a short-term cooldown is likely before any fresh leg higher.
Whale wallets holding nearly 90% combined can move the price sharply on their own.
Thin liquidity at 2.10% of market cap amplifies both upside and downside swings.
No confirmed spot demand beyond the breakout session, and that flow could fade.
A close back below $0.0982 would break the current structure and open the path toward $0.0880.
For listing and unlocking context across the sector, the crypto exchange listing tracker is worth checking before sizing any position.
Disclaimer: This article is for informational purposes only and is not financial advice. Crypto assets, especially low-cap tokens like TIBBIR, carry high volatility and risk of total loss. Always do your own research before trading.

















