Dogecoin Price Prediction: Can $DOGE Finally Break Out of This Range?


$DOGE is trading at $0.06988 right now, down a slight 0.4% today, basically flat.
Dogecoin's been around since December 2013, started by Billy Markus and Jackson Palmer as a joke riffing on the Shiba Inu meme, and somehow it's outlasted most of the coins that took themselves seriously.
These days it's the tenth-largest crypto by market cap, still riding a mix of genuine community loyalty and whatever attention Elon Musk happens to throw its way.
Right now, though, this dogecoin price prediction has less to do with memes and more to do with two overlapping chart patterns squeezing price toward a decision point, one on the hourly, one on the four-hour.
Live DOGE Price Data
Doge is currently trading at $0.06988, down 0.4% in a daily range between $0.06913 and $0.07085. 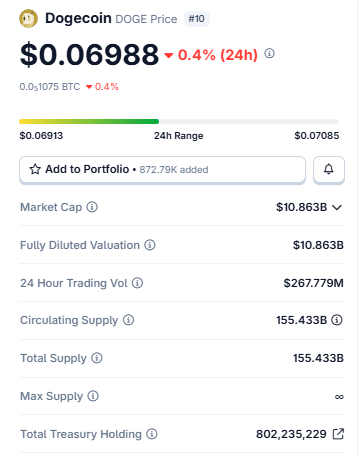
Source: $DOGE market cap data taken from Coingecko, data as of Aug 10, 2026. Figures may vary slightly across other tracking websites.
The market cap is at $10.863 billion. No max supply cap on DOGE, so FDV lands on that exact same number.
Circulating supply, 155.433 billion, all of it already out there. Daily volume came in around $267.779 million.
One thing worth flagging for this dogecoin price prediction is that treasury holdings tied to $DOGE currently sit above 802 million tokens, a number some traders keep an eye on for accumulation or distribution signals.
Liquidation Data and Exchange Volume
$1.10 million wiped out over 24 hours, and longs took nearly all of it, $973.55K against a thin $121.87K on shorts. 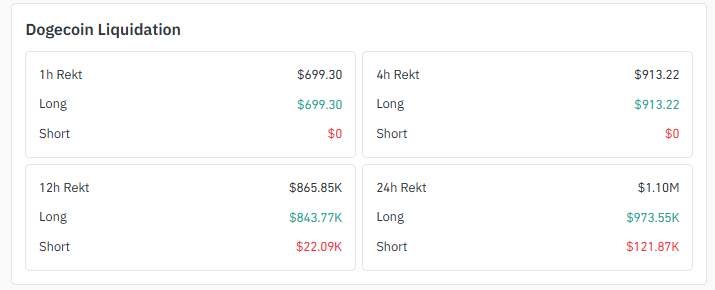
Source: Liquidation Data Taken From Coinglass .
Same lopsided story in the 12-hour window, $865.85K total, long to dominate again at $843.77K. Both the 4-hour and 1-hour windows? Long liquidations only, nothing on the short side.
Reads like traders leaning bullish keep getting caught out by DOGE's sideways chop rather than anything sharp.
Binance runs the show volume-wise at $225.48 million, more than double OKX's $132.43 million. 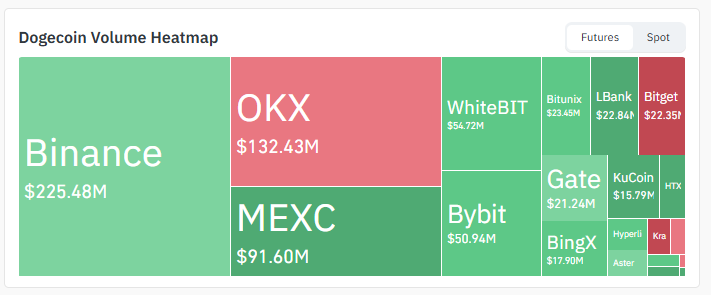
Source: Volume Heatmap Data Taken From Coinglass.
MEXC follows at $91.60 million, with Bybit and WhiteBIT both hovering near $50 million. Smaller slices go to Bitunix, LBank, Bitget, BingX, Gate, and KuCoin.
Key Takeaways
-
Flat-ish day, down 0.4%, DOGE sitting near $0.06988
-
Two patterns stacked on top of each other right now, a channel and a triangle
-
Longs are the ones eating the liquidations lately, not shorts
-
Binance alone is doing almost double what OKX, the next biggest, is running
-
Whichever way these patterns break first will probably set the tone
Technical Analysis: What The Charts Are Saying
Hourly Chart Analysis
$DOGE is boxed inside a descending channel. 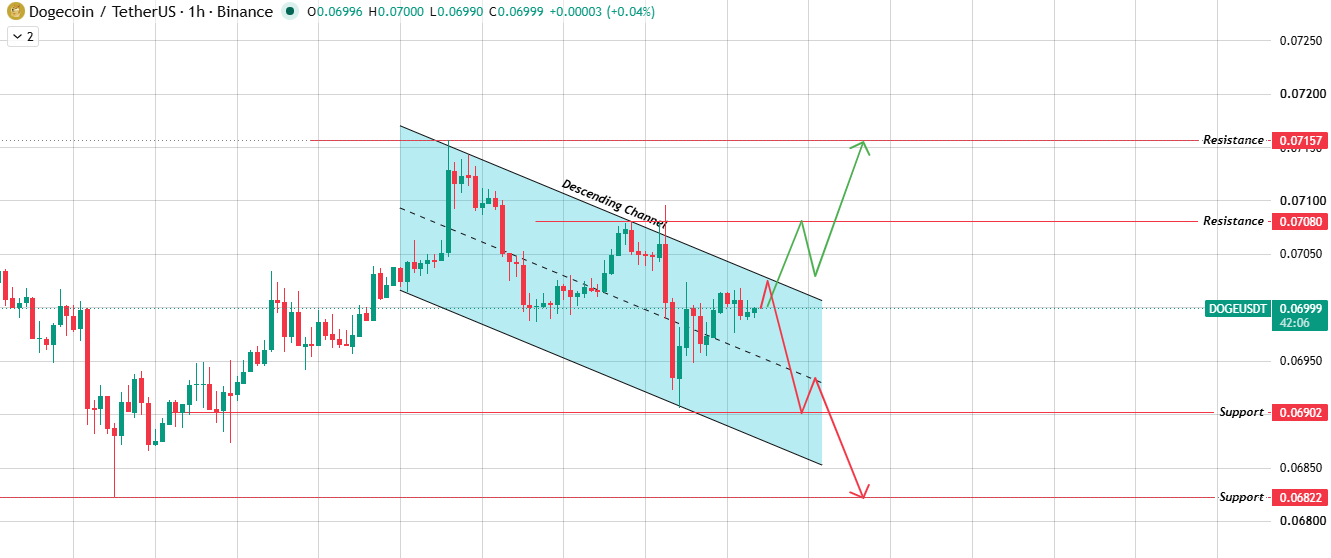
Source: Chart Taken From TradingView.
Clear the upper boundary with volume behind it, and $0.07080 opens up, and $0.07157 after that.
Get rejected up top instead, slide back to the channel's lower edge, break that too, and $0.06902 is next, then $0.06822 underneath.
4-Hour Chart Analysis
A wider view shows $DOGE squeezed inside a symmetrical triangle, the price sitting almost right at the apex now, which usually means resolution's close.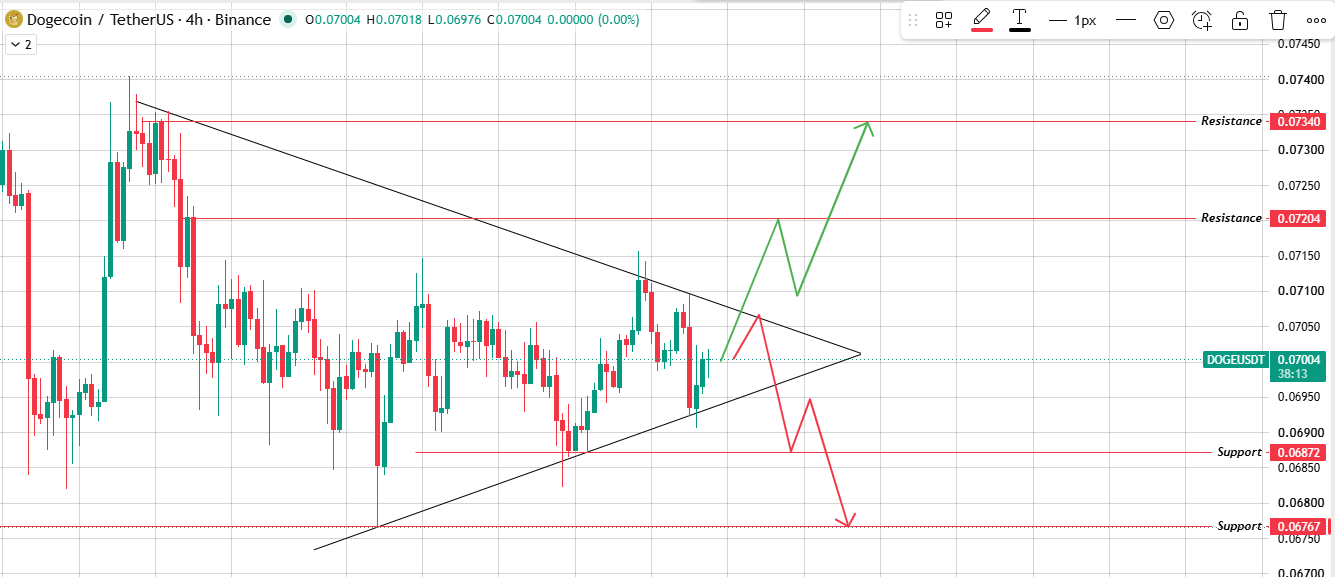
Source: Chart Taken From TradingView .
Break the upper boundary; $0.07204 comes into view, maybe $0.07340 if momentum carries.
Break the lower boundary instead; support waits at $0.06872 and $0.06767 beneath that.
Bull, Base, and Bear Case
Social Sentiment of $DOGECOIN
There's talk circulating about a potential move well past 150% if DOGE clears its major resistance, the kind of headline that spreads fast whenever a token coils into a tight pattern like this one. 
Source: Data Taken From @TOPDOGE007 , X Account.
Not entirely baseless, either; a confirmed breakout genuinely would open room for a bigger move.
Still, triple-digit claims belong in the "possible scenario" bucket, not the "likely outcome" one, and this dogecoin price prediction sticks closer to what the actual chart's showing than to any single headline making the rounds.
Long-Term Outlook
Everything hinges on how these two patterns resolve.
Clean break above resistance, ideally with Binance-level volume backing it, and the broader dogecoin price prediction leans more bullish toward $0.073 to $0.074.
Breakdown instead, and the lower $0.067 to $0.068 zone becomes the focus. Given how tight this compression's gotten, don't expect it to drag on much longer either way.
Glossary
Lower highs, lower lows, boxed between two parallel lines sloping down, that's a descending channel.
A symmetrical triangle narrows as resistance slides down and support climbs up at roughly matching angles, usually breaking out somewhere near the apex.
Liquidation is what happens when an exchange force-closes a leveraged position because the trader's losses have piled up too far to cover.
FDV, fully diluted valuation, is total supply times current price. With DOGE having no max supply cap, it lines up exactly with market cap.
Treasury holdings are DOGE tokens sitting in reserve, usually tied to known large wallets or foundations, and traders sometimes track them for hints of buying or selling ahead.
Methodology
This dogecoin price prediction leans on TradingView chart readings across the 1-hour and 4-hour timeframes, combined with liquidation and volume data from Coinglass.
Every support, resistance, and pattern level here comes straight off observable chart structure, nothing extrapolated.
Given how tightly price is compressed inside both patterns right now, this one's worth revisiting the moment either boundary actually breaks.
Disclaimer: This article is for informational purposes only and does not constitute financial advice. Cryptocurrency markets are highly volatile, and past price behavior does not guarantee future results. Always conduct independent research before making investment decisions.

















