Verified Emeralds Price Prediction: Can $VEREM Hold This 42% Surge


A green-lit protocol post, one thin order book, and a coin that fell 98% from its high just found its loudest week yet. Whale wallets moved first, the chart flipped fast, and now traders want to know if this bounce actually means something or if it is just another trap before the next leg down.
Something Woke VEREM Up, But Is It Real
Verified emeralds price prediction questions started flooding in the moment VEREM ripped higher this week, and honestly, the move deserves a second look before anyone gets excited. This is a token that lost almost everything since January, then bounced off a multi-month low in a matter of days. Readers comparing it against other altcoin price prediction calls will notice this one moves faster than most.
Here's the thing: a 42% daily candle on a token with under $17 million in market cap does not need a huge crowd. It needs a few large wallets and a headline. Timing lines up with a broader coin events calendar window where several small caps saw thin-liquidity spikes.
But does a bounce off the bottom mean the blogdown is over? Or is this the kind of relief rally that traps buyers right before liquidity dries up again?
What Actually Happened
VEREM, the token behind the Verified Emeralds RWA project, posted on X about "redefining value" and building infrastructure that is more transparent and more programmable. Nothing revolutionary in the wording. And yet volume exploded right after.
Trading volume jumped over 224% in 24 hours, landing near $567,000 against a market cap of roughly $16.9 million. That is a volume-to-market-cap ratio near 3.35%, which is high for a token this small. Whales noticed first.
We pulled up the on-chain holder data, and the picture is not subtle. The top 10 wallets hold 95.55% of supply, and one locked liquidity wallet alone controls 95% of the total. A Gini score of 0.9905 confirms it: this is about as concentrated as a token can get.
Market Snapshot, As of August 10, 2026, 06:49 UTC
As of this research timestamp, VEREM traded at $6.99 on the VEREMUSDT 1D chart, up 4.33% intraday and roughly 42.72% on a 24-hour basis according to CoinMarketCap. Market cap sits near $16.9 million against a fully diluted valuation of $338 million, a gap that matters more than most traders admit. The circulating supply is 2.5 million VEREM out of a 50 million max, with 30,757 holders on record.
The all-time high was $397.66 on January 23, 2026. The all-time low, $2.27, was set just three days before this snapshot. Momentum flipped fast, and macro backdrop matters too, with Fed meeting news keeping risk appetite jumpy across small caps this week.
Chart Analysis
VEREM Short-Term Technical Analysis (Daily)
VEREM/USDT fell steadily from mid-teens toward $2 into May, then formed a falling wedge.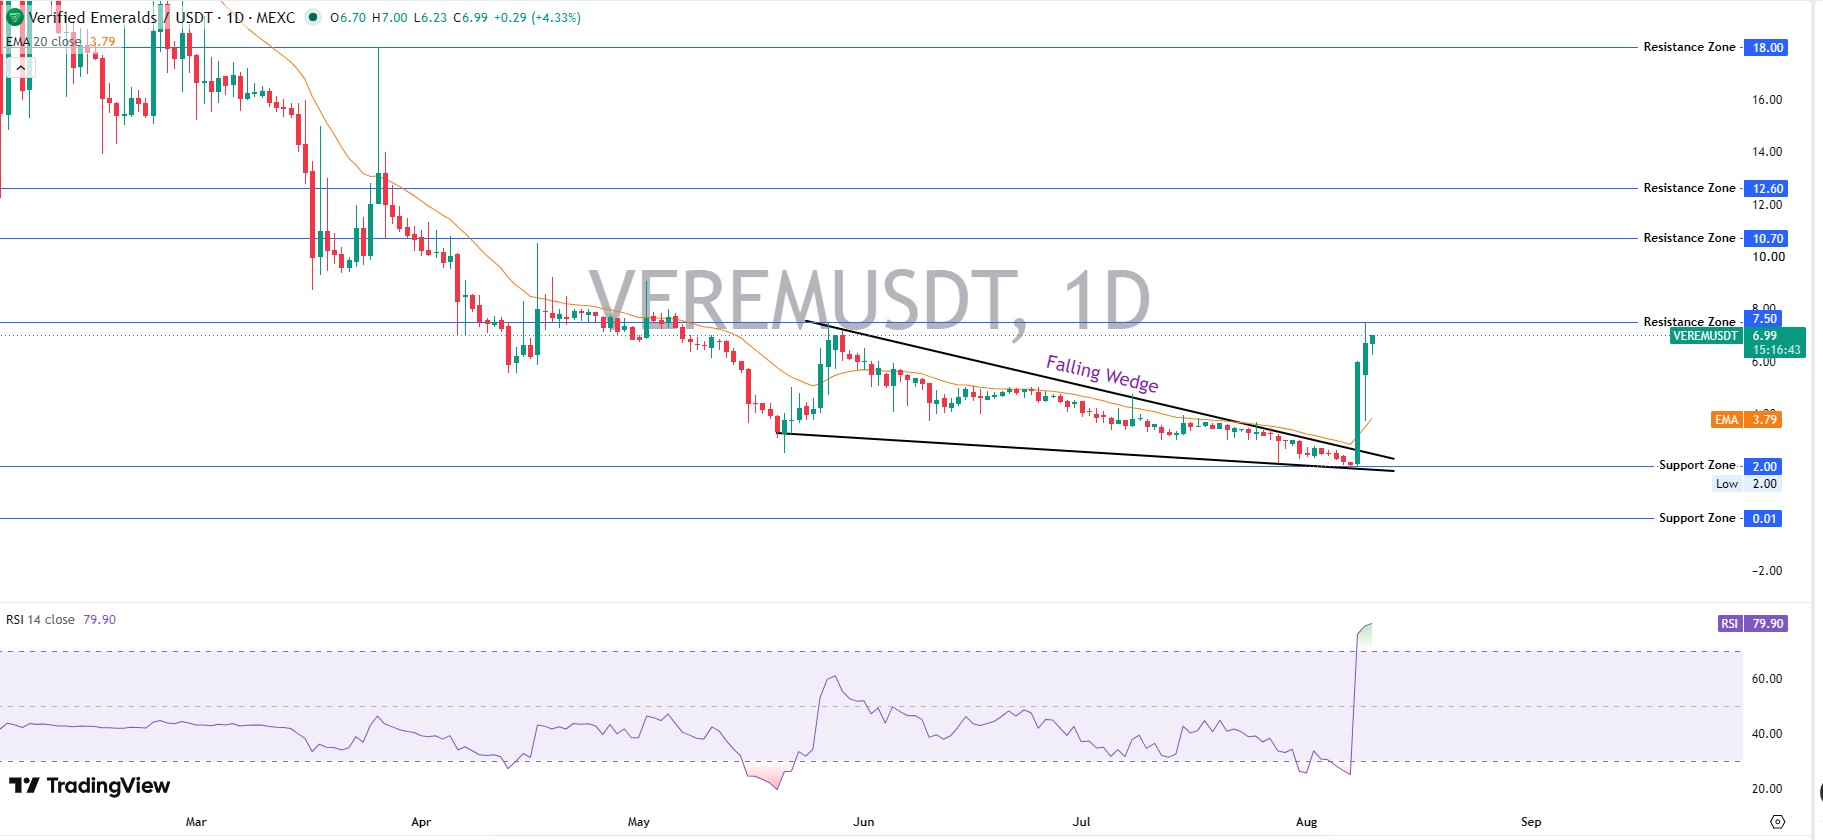
Price just broke sharply above the wedge with a large green candle, jumping from $3 to $7, closing at $6.99 (+4.33%). RSI spiked to 79.90, deep in overbought territory, suggesting a pause or pullback is likely before further upside.
Immediate resistance sits at $7.50, then $10.70 and $12.60. Support has shifted to the $2.00 zone. Bullish structurally, but chasing here is risky; a retest of $6-7 would be a safer entry point.
VEREM Long-Term Technical Analysis (Weekly)
Zooming out, VEREM remains inside a descending channel on the weekly chart that started in late January, right after the token's all-time high.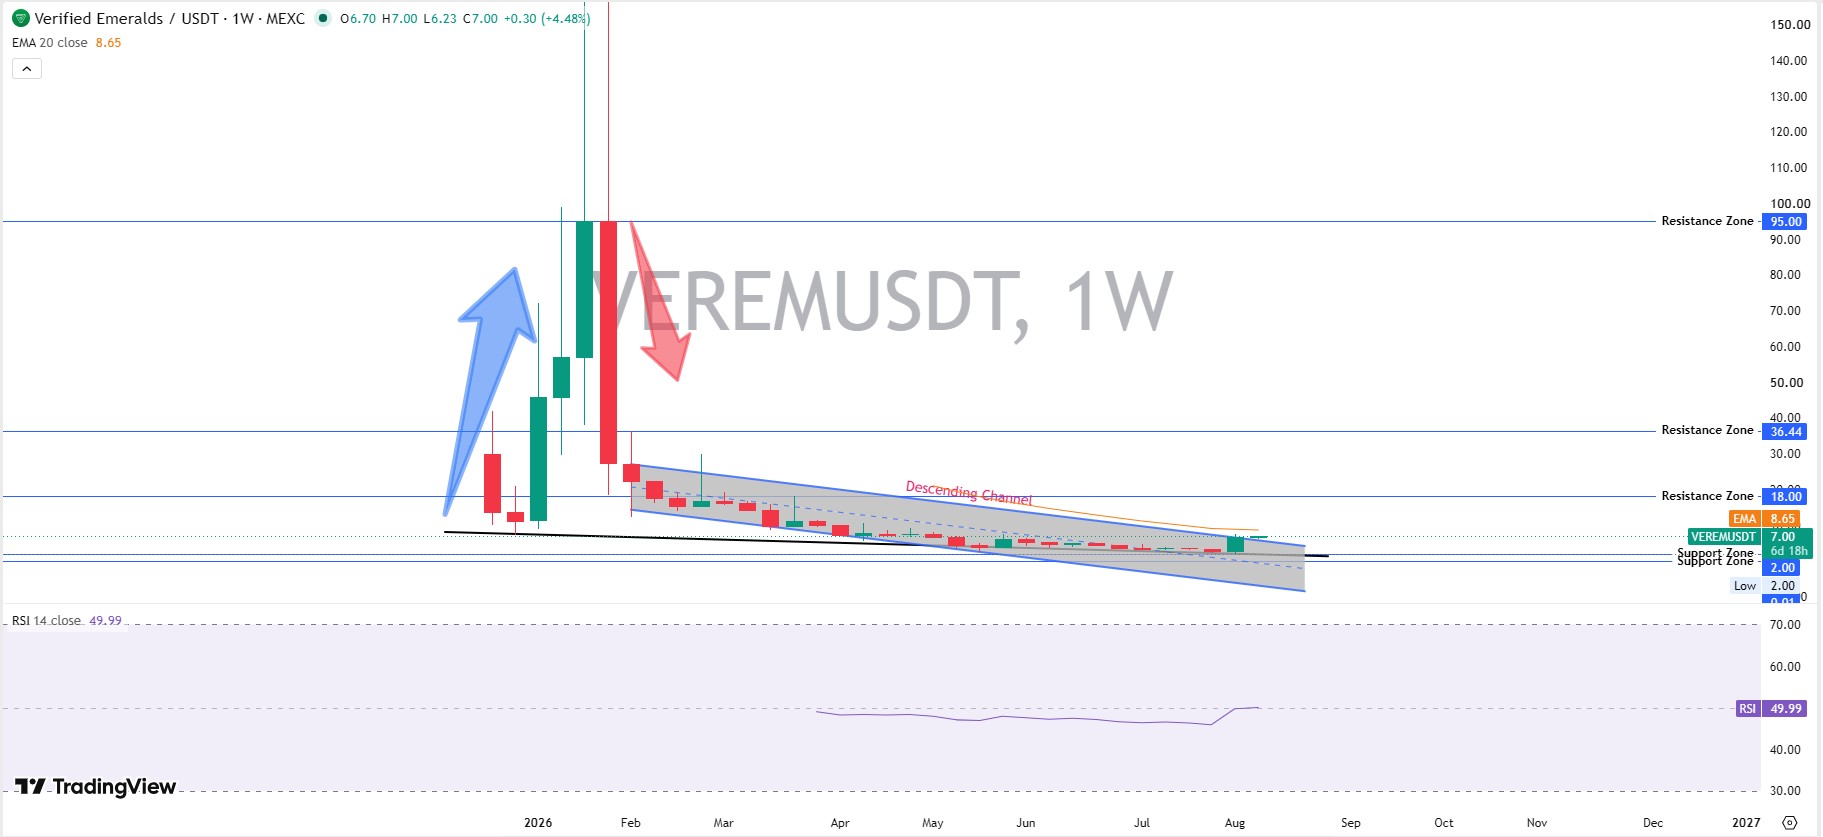
Weekly RSI near 49.99 is neutral, not confirming the daily excitement yet, which tells us the bigger trend has not turned. The 20-week EMA sits near $8.65, still above spot price, another sign this bounce has work left to do.
Major resistance stacks at $18.00, then $36.44, then $95.00, levels this token has not touched in months. Until price clears the channel's upper boundary on a weekly close, this bounce reads as a relief move inside a longer downtrend, not a confirmed reversal.
Altcoin Fundamentals: RWA Angle and Liquidity Risk
VEREM markets itself as a real-world-asset, or RWA, protocol, a category that has drawn genuine crypto exchange listing interest this cycle. But fundamentals here look thin. FDV runs 20 times above market cap, meaning most supply has not entered circulation and unlock behavior could pressure the price later. Liquidity-to-market-cap sits at just 0.01%, which explains why a single wallet's activity can swing price double digits in a day.
Tokenomics and Whale Concentration
VEREM runs a fixed 50 million max supply, with 2.5 million circulating and roughly 30,757 holders on the books. That gap between circulating and max supply is exactly why the $338 million FDV figure matters more than the $16.9 million market cap headline.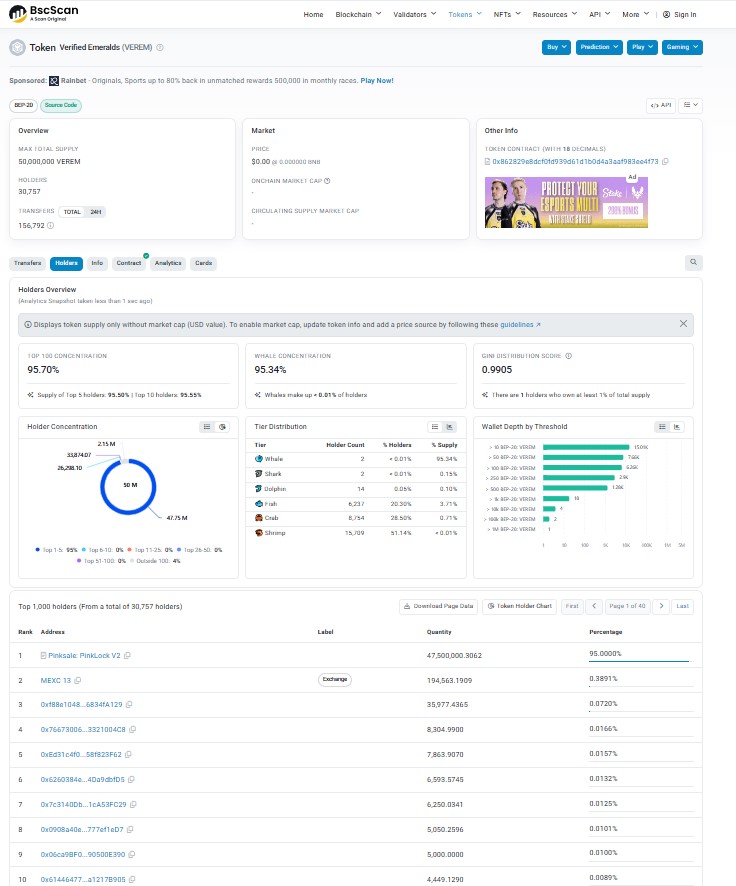
Wallet-level data tells the sharper story. The top single address, tagged Piksale PinkLock V2, holds 47.5 million VEREM, or 95% of the supply. That reads less like a hidden whale and more like locked liquidity sitting behind a lock contract, though it still counts toward the 95.34% whale concentration figure.
The next largest wallet belongs to MEXC, an exchange, holding 194,563 VEREM, just 0.39% of supply. Everything past that thins out fast into sub-0.1% wallets. Categorizing holders this way, locked liquidity, exchange, and scattered retail, matters more than the raw concentration number alone.
A Gini distribution score of 0.9905 confirms the imbalance mathematically. Scores that close to 1.0 mean almost all value sits with almost none of the addresses, so any tokenomics read on VEREM has to start there, not with the price chart.
Bear, Base, and Bull Scenarios
Timeframe | Bear Case | Base Case | Bull Case | Key Level | Invalidation |
7D | $4.50 | $6.50–$7.50 | $10.70 | $7.50 resistance | Close below $5.50 |
30D | $2.50 | $8.00–$12.60 | $18.00 | $2.00 support | Break below $2.00 |
Early 2027 | $1.80 | $12.60–$18.00 | $36.44 | $18.00 resistance | Weekly close below $2.00 |
Probabilities lean roughly 35% bear, 45% base, and 20% bull given the thin liquidity backing this move. The early 2027 outlook stays contingent on VEREM clearing the weekly descending channel first, since nothing beyond that structure has real evidence behind it yet.
Risks Worth Knowing
Whale concentration above 95% means one wallet decision can move this market more than any news cycle. And with FDV dwarfing market cap, future unlocks are a real overhang. Anyone tracking Bitcoin price prediction 2026 trends alongside altcoins should weigh this liquidity gap heavily.
Regulatory headlines add another layer. Ongoing debate around the Clarity Act and Senate crypto could shift market sentiment for smaller RWA tokens like VEREM faster than any chart pattern, and that shift alone can move the future price of a low-liquidity token like this one more than any single indicator.
Conclusion
This verified emeralds price prediction ultimately hinges on one thing: does volume stick around after this week's spike, or does it fade like the last bounce did? The setup is technically bullish above $7.50 but fragile below it. Watch $2.00. That level breaking would undo the entire recovery story, and traders watching Ethereum price prediction 2026 coverage will recognize a similar pattern of relief rallies fading fast in this market.
Disclaimer: This article is for informational purposes only and is not financial advice. Crypto assets, especially low-liquidity tokens like VEREM, carry significant risk of loss.

















