MASSIVE $1.6M RAISED: BDAG Behind Chart Secret, BlockDAG Global Launch


BlockDAG's official account is promoting a weekend milestone: $1.6M moved into BDAG over two days.
Meanwhile, the chart tells a different immediate story: BDAG is down 3.44% today to $0.00003515.
This piece keeps the tweet's claims and the chart's technical data in separate, clearly divided sections before building full 2026 and five-year outlooks for the BlockDAG Global Launch.
What the Official Tweet Actually Claims
BlockDAG's post states $1.6M was moved into BDAG over the weekend, framed with the line "Quit watching other buyers move first."
Source: Posted on X by @blockdagnetwork
It reiterates that Global Launch is set for September 1 and that the after-sale phase is closing and repeats the promotional entry price of $0.00000006 with a stated 132x ROI potential, 100% launch-day unlock, and no vesting.
Live BDAG Data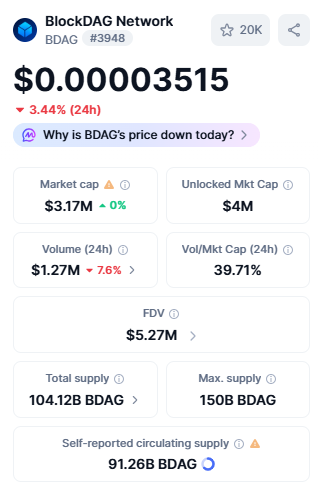
Source: BDAG Price dashboard by CoinMarketCap, captured August 10, 2026
Metric | Value |
Current Price | $0.00003515, down 3.44% (24H) |
Market Cap | $3.17M (unchanged, 0%) |
Unlocked Market Cap | $4M |
24H Volume | $1.27M, down 7.6% |
Vol/Mkt Cap (24H) | 39.71% |
FDV | $5.27M |
Total Supply | 104.12B BDAG |
Max Supply | 150B BDAG |
Self-Reported Circulating Supply | 91.26B BDAG |
The ROI Math Still Does not reconcile
Dividing the current live price ($0.00003515) by the cited promo price ($0.00000006) gives approximately 586x, not the stated 132x.
This gap has now appeared across multiple official BlockDAG posts and remains unaddressed in available material.
Readers should treat the 132x figure as unverified against live pricing, making it an unreliable basis for any BlockDAG price prediction.
Chart & Technical Analysis (Independent of the Tweet)
Every Level Marked on the Chart: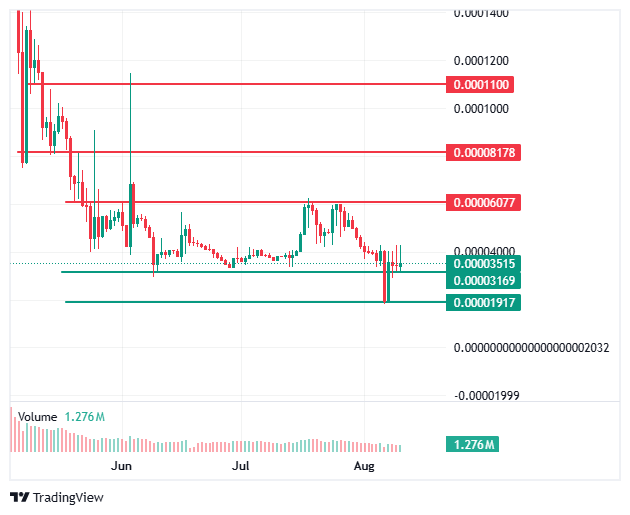
Source: BDAG Trading Chart by CoinMarketCap, captured August 10, 2026
Level Type | Price |
Resistance 3 (outermost, upside) | $0.0001100 |
Resistance 2 (upside) | $0.00008178 |
Resistance 1 (nearest, upside) | $0.00006077 |
Current Price / Pivot | $0.00003515 |
Support 1 (nearest, downside) | $0.00003169 |
Support 2 (lowest marked, downside) | $0.00001917 |
Price currently sits at its pivot zone, having pulled back from a late-July recovery attempt that stalled well below the first resistance, and is now testing the upper edge of its nearest support.
These support and resistance zones form the primary technical framework for the current BlockDAG price prediction.
Downside Path: What Happens If Both Supports Break
If the price breaks below the nearer support at $0.00003169, the next and only remaining marked level is $0.00001917.
A confirmed break below both of these support levels in sequence would put BDAG into new all-time-low territory, since no further support appears anywhere on the current chart below $0.00001917.
This is the clearest downside risk on the chart: once $0.00001917 fails, there is no marked floor beneath it.
Upside Path: All Resistance Levels in Sequence
If the price instead reverses higher off the current pivot, resistance applies in this exact order: $0.00006077 first (nearest), then $0.00008178, then $0.0001100 as the outermost and final marked level on the chart.
Today's 39.71% Vol/Mkt Cap ratio shows meaningful trading interest still exists despite the 7.6% volume decline, but confirming a break of even the first resistance would require that interest to reverse direction from today's selling.
Does the Tweet's Raise Figure Match the Chart's Behavior?
Not clearly. A genuine $1.6M weekend inflow would typically coincide with rising price and rising volume.
Today's chart shows the opposite: price down 3.44%, volume down 7.6%. If the raise figure is accurate, it has not yet shown up as net buying pressure on the chart, which keeps the near-term BlockDAG price prediction cautious.
BlockDAG Price Prediction: 2026 Outlook
Scenario | Estimated Price Range | Key Drivers |
Bear Case | $0.000019-$0.000032 | Break below both $0.00003169 and $0.00001917 supports, confirming new all-time-low territory |
Base Case | $0.00004-$0.00006 | Price holds above $0.00003169, Global Launch (Sept 1) proceeds as stated, volume stabilizes |
Bull Case | $0.00008-$0.00011 | Confirmed breakout through all three resistance levels in sequence, sustained volume, successful Global Launch execution |
BlockDAG Price Prediction: 5-Year Outlook
Scenario | Estimated Price Range | Key Drivers |
Bear Case | $0.00001-$0.00004 | Repeated unreconciled ROI claims erode trust and weak post-launch adoption |
Base Case | $0.0001-$0.0004 | Steady ecosystem growth and gradual supply unlock absorbed organically |
Bull Case | $0.0008-$0.002 | Strong long-term adoption, favorable broader crypto cycle, utility-driven demand replacing promotional-driven demand |
Methodology Note
These tables are built from current chart levels and stated tokenomics (104.12B total supply, 150B max supply), not the unreconciled 132x ROI claim, which is explicitly excluded as a basis for any scenario.
Risks Worth Naming
The clearest downside risk is structural: only one support level ($0.00003169) stands between the current price and a break that would put BDAG into new all-time-low territory with no further marked floor.
Second, the tweet's $1.6M raise claim does not currently align with today's falling price and volume.
Third, the 132x ROI figure still does not reconcile with live pricing across multiple posts.
Fourth, self-reported circulating supply (91.26B of 150B max) remains project-disclosed, not independently audited.
Glossary
Pivot Zone: A price level acting as a decision point between the nearest support and resistance.
Vol/Mkt Cap Ratio: Daily trading volume divided by market cap, indicating how actively a token trades relative to its size.
Disclaimer
Informational purposes only, not financial advice. The 132x ROI figure cited in official BlockDAG marketing does not reconcile with current live price data. Price prediction ranges above are analyst estimates based on chart levels, not guarantees. Self-reported supply figures are project-disclosed, not independently audited. Cryptocurrency carries significant risk of loss.

















