Why $BEAT Crash 30% Today? Audiera Price Prediction


Audiera just got crashed. $BEAT is down over 92% this past month and 30% today after a brutal red candle wiped out $1.63M in leveraged positions in a single day, most of it longs.
The token crashed straight through a level it had held for weeks and hasn't looked back since the panic is spreading fast.
Is this Audiera price prediction dip a buying opportunity, or is there more pain coming for BEAT?
Market data was checked on September 10, 2026, at 11:55 IST.
Audiera Price Prediction Today: Market Overview
Metric | Value |
Price | $0.08582 |
24h Change | -30% |
Market Cap | $29.241M |
Fully Diluted Valuation | $85.56M |
24h Volume | $6.675M |
24h Range | $0.0852 – $0.1266 |
Circulating Supply | 341.767M |
Total Supply | 1B |
Source: Data from CoinGecko as of September 10, 2026, at 11:55 IST. Figures may vary slightly across other tracking websites.
Audiera Liquidation Data: Futures Rekt Report
Liquidation and volume figures below are pulled from futures markets and kept separate from spot activity.
Source: Data From CoinGlass
Window | Total Rekt | Long | Short |
1h | $282.53 | $282.53 | $0 |
4h | $29.37K | $29.19K | $174.60 |
12h | $1.53M | $1.44M | $85.51K |
24h | $1.63M | $1.54M | $85.64K |
The 12h and 24h numbers make it clear this was a long-side wipeout, with over $1.4M in long positions liquidated as the price broke down.
Futures volume is led by Binance at $37.81M, followed by OKX ($26.93M), LBank ($15.39M), Bybit ($13.62M), Gate ($10.32M), and BingX ($9.68M), with smaller volume spread across MEXC, KuCoin, Bitget, and Bitunix.
Audiera Price Prediction Technical Analysis
Pair: BEAT/USD · Market: Spot (Crypto) · Exchange: TradingView · Timeframe: 4H · Timestamp: September 10, 2026, 11:55 IST
Price had been consolidating along a rising support trendline for weeks before breaking down sharply through the $0.12000 level, a zone that had held as support since late August.
That break triggered a fast slide toward $0.08020, where the price is now sitting just above.
An HTF liquidity pool further above in the $0.14 to $0.16 region, levels that would only come back into play if BEAT reclaims $0.12945 first.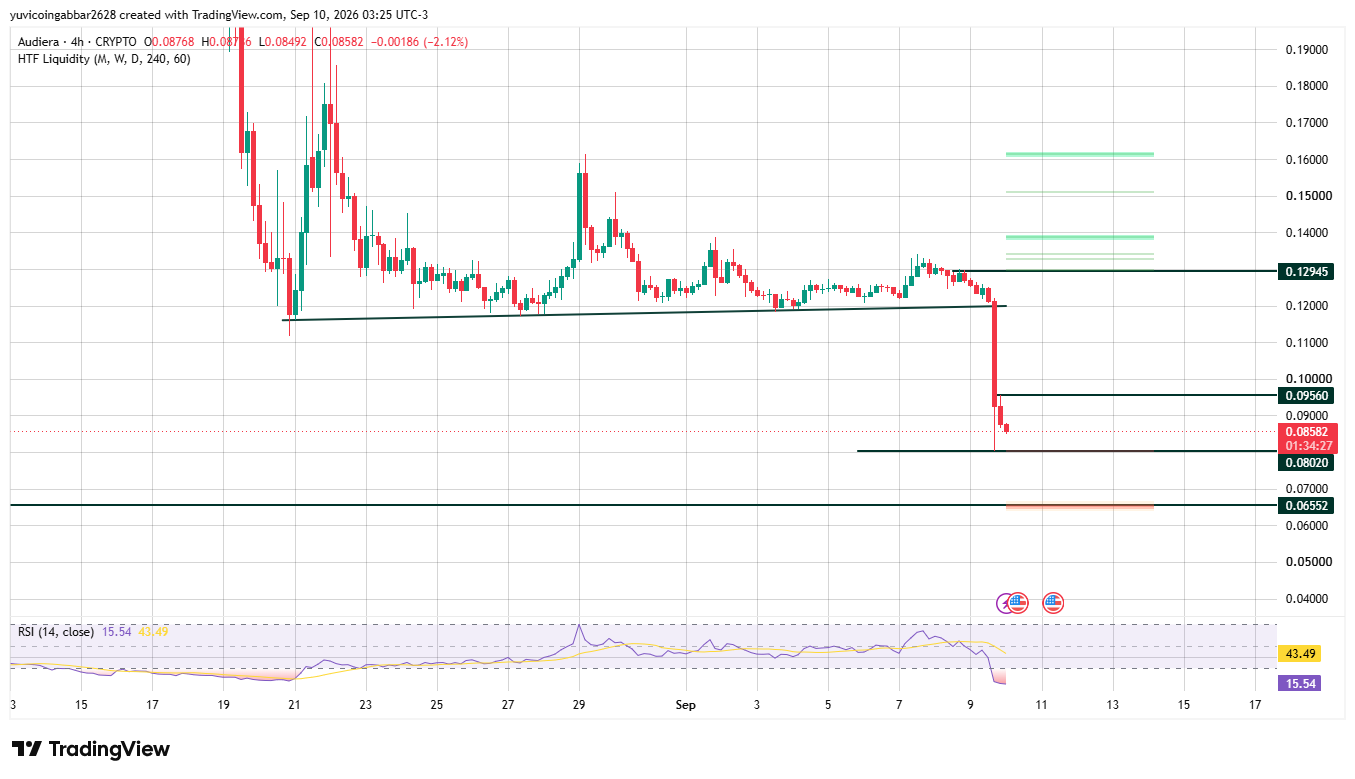
Audiera News Today: Key Levels
Level Type | Price |
Resistance 2 (broken support, now overhead) | $0.12945 |
Resistance 1 (nearest) | $0.09560 |
Immediate Price Reference | $0.08582 |
First Confirmed Support | $0.08020 |
Deeper Support | $0.06552 |
Audiera Forecast: Bull Case vs Bear Case
Bull case: Holding above $0.08020 and reclaiming $0.09560 would be the first sign this crash is stabilizing rather than continuing.
A confirmed move back above $0.12945 would flip that former support back into play and open room toward the unlabeled liquidity pools higher up.
Bear case: A break below $0.08020 would expose $0.06552 as the next real support test, and given the scale of long liquidations already seen, further downside pressure from panic selling can't be ruled out.
Losing $0.06552 would put BEAT into fresh multi-month lows.
Audiera Price Scenarios: Triggers and Invalidation
Scenario | Trigger | Likely Outcome | Invalidation Point |
Stabilization | Hold above $0.08020 | Range-bound recovery toward $0.09560 | Close back below $0.08020 |
Continued Downtrend | Break below $0.08020 | Slide toward $0.06552 | Reclaim of $0.08020 |
Recovery | Close above $0.09560 | Move back toward $0.12945 | Rejection at $0.09560 |
Can BEAT Reach $0.12945 Again?
$0.12945 is the highest clearly marked resistance level on the chart, and it's also the support BEAT just lost.
Reclaiming it would require BEAT to first clear $0.09560 and hold above it, since that's the immediate hurdle standing between the current price and the old range.
Audiera Price Prediction: Bitcoin's Role in the Bigger Picture
Broader market conditions matter even more for a token this deep in a drawdown.
Most Bitcoin price prediction outlooks for the current cycle note that small-cap altcoins like BEAT tend to struggle to find a floor if Bitcoin itself is weak, since risk appetite for low-liquidity tokens usually dries up first in a broader pullback.
Audiera Price Prediction 2026: Expert View
According to CoinGabbar analysts, The break above $0.12945 and the scale of long liquidations point to a token still working through forced selling rather than finding demand. $0.08020 is the level to watch first; losing it would open the door to $0.06552.
Disclaimer: This piece is for informational purposes only and isn't financial advice. The levels and scenarios above are based on technical chart analysis and publicly available data at the time of writing, and crypto markets can move sharply within hours, so past patterns don't guarantee future outcomes. It's worth doing independent research and considering your own risk tolerance before acting on any of the levels discussed here.
1 month ago
HOW TO GET A PROFESSIONAL RECOVERY EXPERT IN CANADA, UNITED STATES, MEXICO, INDIA, CHINA META TECH RECOVERY PRO META TECH RECOVERY PRO is a trusted, independent cyber-intelligence and digital recovery firm. We investigate and remediate sensitive information incidents across multiple blockchain and financial environments, including Bitcoin, USDT, USDC, Ethereum, and other widely used digital assets. Our mission is to help clients regain control, protect data, and restore integrity after unauthorized access, fraud, personal information exposure, or inappropriate online content. WhatsApp +1 469 692 8049 Using disciplined digital forensics and risk analysis, we provide end-to-end recovery support: tracing suspicious activity, identifying likely sources of cyber incidents, reconstructing event timelines, and performing secure data recovery when feasible. We also assist with consent-free exposure removal or erasure, including confidential records, private images, doxing-related content, and other materials that violate privacy standards. Contact them via Metatech@Writeme.Com Our method is professional and structured: each engagement begins with an assessment of incident scope, impacted platforms or accounts, and available indicators. We then apply targeted techniques such as digital footprint analysis, linkage evaluation across online identifiers, and verification of transaction or account trails to determine the most effective recovery and mitigation path. We operate under a NO UPFRONT fee model until completion, ensuring accountability, aligning incentives with client objectives, and reducing financial uncertainty. Clients typically seek help with hacked wallets or compromised accounts, suspicious crypto transfers, identity exposure, unlawful posting of private content, impersonation, online harassment, and other forms of digital wrongdoing.Reach out to them via - Telegram:@metatechrecoveryproteam - - WhatsApp: + 1 4 6 3 2 2 7 7 6 4 0 - - Call + 1 4 6 3 2 2 7 7 6 4 0 -

1 month ago
HOW TO GET A PROFESSIONAL RECOVERY EXPERT IN CANADA, UNITED STATES, MEXICO, INDIA, CHINA META TECH RECOVERY PRO META TECH RECOVERY PRO is a trusted, independent cyber-intelligence and digital recovery firm. We investigate and remediate sensitive information incidents across multiple blockchain and financial environments, including Bitcoin, USDT, USDC, Ethereum, and other widely used digital assets. Our mission is to help clients regain control, protect data, and restore integrity after unauthorized access, fraud, personal information exposure, or inappropriate online content. WhatsApp +1 469 692 8049 Using disciplined digital forensics and risk analysis, we provide end-to-end recovery support: tracing suspicious activity, identifying likely sources of cyber incidents, reconstructing event timelines, and performing secure data recovery when feasible. We also assist with consent-free exposure removal or erasure, including confidential records, private images, doxing-related content, and other materials that violate privacy standards. Contact them via Metatech@Writeme.Com Our method is professional and structured: each engagement begins with an assessment of incident scope, impacted platforms or accounts, and available indicators. We then apply targeted techniques such as digital footprint analysis, linkage evaluation across online identifiers, and verification of transaction or account trails to determine the most effective recovery and mitigation path. We operate under a NO UPFRONT fee model until completion, ensuring accountability, aligning incentives with client objectives, and reducing financial uncertainty. Clients typically seek help with hacked wallets or compromised accounts, suspicious crypto transfers, identity exposure, unlawful posting of private content, impersonation, online harassment, and other forms of digital wrongdoing.Reach out to them via - Telegram:@metatechrecoveryproteam - - WhatsApp: + 1 4 6 3 2 2 7 7 6 4 0 - - Call + 1 4 6 3 2 2 7 7 6 4 0 -
1 month ago
Good day everyone, My name is Rayan I was once a victim of $300,000 btc investment scam. I was so devastated at that point because the police won’t look into the matter. I made different enquiries on what to do to recover my lost bitcoin. A friend referred me to this recovery firm who was able to retrieve my stolen bitcoin. I contacted them on recoverydarek @gmail com and they came through in less than 24hrs after contacting them, to deliver my funds back to me.

















