Audiera Price Prediction: Can $BEAT Hold Its 44% Rally?


A sudden cold wallet transfer just sent one small-cap AI token into a near-vertical move, and traders are asking whether it's the start of something bigger or a setup for a hard reversal. What happened behind the scenes, and what's it worth right now?
What's Fueling the Sudden Move in Audiera Right Now
Audiera price prediction talk is spreading fast today, and it's not hard to see why. BEAT just ripped higher while most of the broader market stayed flat, and that kind of divergence always grabs attention.
Here's the thing: sharp, isolated moves like this rarely come from nowhere.
Something shifted behind the scenes on the exchange side, and traders are trying to figure out if it's the start of a real trend or just a fast, thin-liquidity spike that fades. And that's exactly the question we're digging into.
So where does BEAT actually stand right now, and what would it take to keep this rally alive?
Key Takeaways
BEAT is trading near $0.1784, up roughly 44% over the past 24 hours.
The move followed a large exchange cold wallet transfer and coordinated markup activity across two exchanges.
24-hour trading volume jumped over 100% to roughly $85.9M.
Key resistance sits near $0.208, with major support around $0.152.
Whale concentration remains extremely high, a real risk for any BEAT price prediction.
Audiera BEAT Price Today: Latest Market Snapshot
As of the latest CoinMarketCap Audiera page snapshot (August 22, 2026, roughly 09:15 UTC), BEAT trades near $0.1784, up about 44.11% in 24 hours.
Market cap sits at $58.97M, with a fully diluted valuation of $178.43M since only 330.51M of the 1B max supply is circulating.
24-hour volume hit $85.65M, a volume-to-market-cap ratio above 144%. That's an unusually hot ratio, and it points to short-term speculation rather than steady accumulation.
Liquidity-to-market cap sits at just 1.69%, thin by most standards. The token is still 98% below its June 2026 all-time high of $11.10, though it's up nearly 169% from its November 2025 low of $0.06755. For wider market context, this altcoin price prediction archive tracks similar small-cap setups.
Why Is Audiera BEAT Price Up Today
The catalyst isn't a listing or a partnership announcement. It's a wallet move.
Gate.io shifted $1.62M worth of BEAT into cold storage, and that came right after a coordinated markup phase alongside KuCoin. When exchanges rebalance inventory like that at the same time the price is thin, it tends to trigger a chain reaction of buying.
We pulled up the CoinGlass volume heatmap, and Binance alone processed $270.99M, with OKX at $181.70M close behind. That's a lot of derivative flow chasing a token with this small a float.
Add in Audiera's own marketing push, an AI-idol driven Web3 music ecosystem the team detailed on X, and retail attention followed the exchange activity almost immediately.
But volume alone doesn't explain everything. And speculation, once it starts, tends to feed itself.
Audiera BEAT Technical Analysis: Chart Reading
The 4-hour TradingView chart shows a recovery pattern. Price carved a rounded bottom near $0.111 before grinding back above the 20 EMA at $0.18163.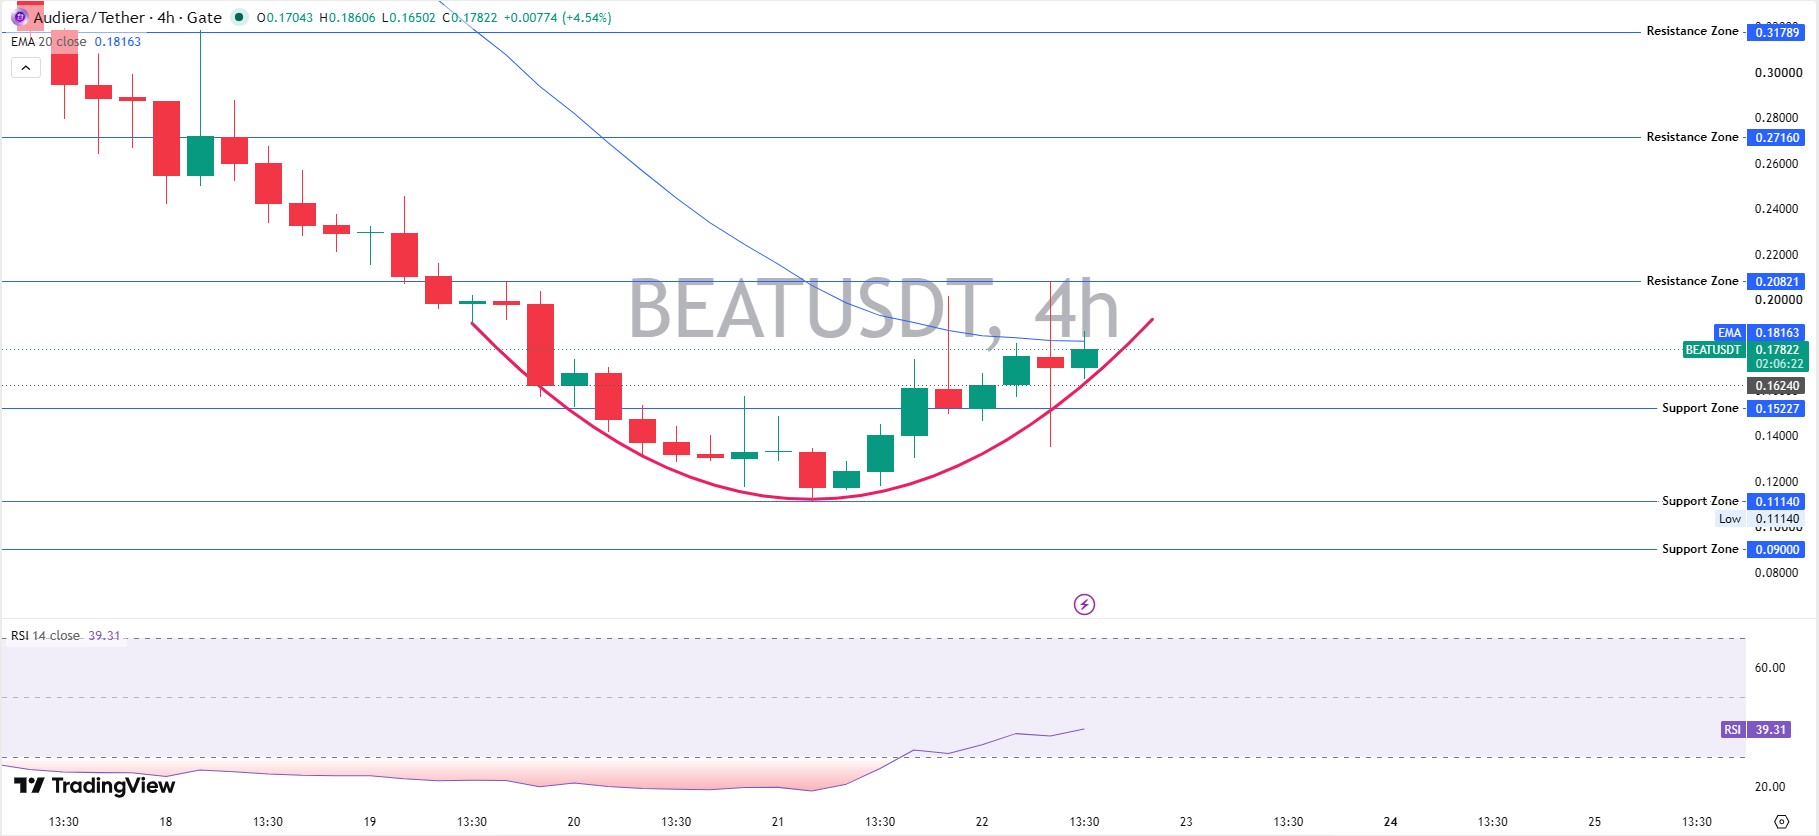
RSI (14) reads 39.31, still on the cooler side despite the rally, which tells us momentum hasn't caught up with trades yet.
There's a rising trendline connecting the recent lows, and trades are currently pressing right into resistance. A break and hold above $0.208 would open the door toward $0.27, while a rejection here likely sends trades back toward the trendline support near $0.16.
None of this guarantees direction. Technical analysis here is descriptive, not predictive, and thin liquidity can distort candles fast.
BEAT Support and Resistance Levels
Support zones cluster at $0.152, $0.111, and $0.090. Resistance zones sit at $0.208, $0.272, and $0.318.
The $0.173 sweep level matters most right now. Holding above it keeps the retest of the $0.21 high in play. Trading back below $0.150 would risk a deeper correction toward the recent lows.
Audiera Whale Concentration and Tokenomics
This is where the BscScan holder data gets uncomfortable.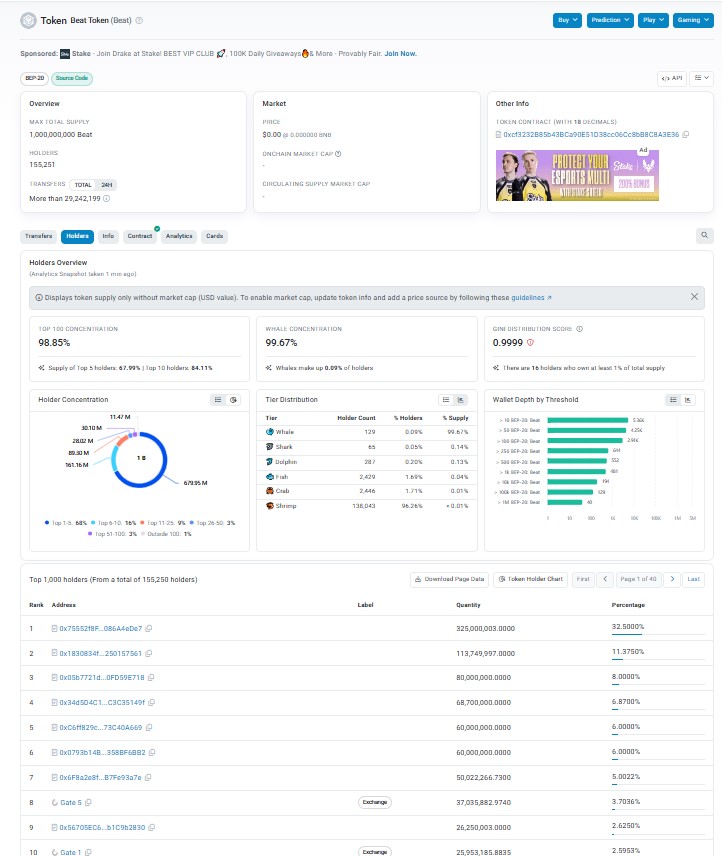
Whale concentration sits at 99.67%, with a Gini score of 0.9999, about as concentrated as a token gets. The top 10 wallets alone hold 84.11% of supply, and two exchange-labeled wallets control over 6% combined.
Turns out, that kind of concentration means a handful of addresses can move this BEAT price prediction in either direction with a single transaction.
Liquidity, Volume and Derivatives Activity
Liquidation data tells its own story. Over 24 hours, $2.79M in positions got liquidated, split between $1.63M in longs and $1.16M in shorts.
Leverage is clearly active here, and the four-hour window alone saw nearly $100K in forced closures. Fast moves, thin liquidity, leveraged trades. That combination cuts both ways, and it tends to track wider Bitcoin market trends during risk-on stretches.
Price Prediction: Bear, Base, and Bull Scenarios
Timeframe | Bear Case | Base Case | Bull Case | Probability | Invalidation |
7 Days | $0.14 | $0.185 | $0.21 | Bear 30% / Base 45% / Bull 25% | Trading below $0.150 support |
30 Days | $0.10 | $0.17 | $0.27 | Bear 35% / Base 40% / Bull 25% | Trading below $0.111 support |
Early 2027 | $0.07 | $0.22 | $0.35 | Bear 30% / Base 45% / Bull 25% | Sustained trading below $0.090 |
What Could Happen Next for BEAT
If BEAT keeps trading above the $0.173 sweep zone, a retest of $0.21 looks realistic within days, not weeks. Keep an eye on the coin events calendar for anything that could shift sentiment fast.
But if selling pressure returns and trades slip under $0.15, this whole move risks getting relabeled as a liquidity-driven spike rather than a trend change. Timing matters here.
Risks Traders Should Watch
Extreme whale concentration and thin float.
Low liquidity-to-market-cap ratio near 1.69%.
Heavy leveraged positioning visible in liquidation data.
No confirmed exchange listing or audited catalyst behind the move, only wallet flow.
Broader policy risk, including ongoing US crypto regulation developments and Federal Reserve policy shifts that move risk assets broadly.
Disclaimer
This article is for informational purposes only and does not constitute financial, investment, or trading advice. Cryptocurrency markets, especially low-cap altcoins like BEAT, are highly volatile and carry significant risk, including total loss of capital. Always do your own research and consult a licensed financial advisor before making investment decisions.











.webp)





