Bitcoin vs PAX Gold: Which Is Better to Buy Right Now?


Bitcoin and gold are two of the biggest safe-haven and risk-asset stories in the market right now, and both charts are giving traders plenty to watch.
$BTC is holding near $79,000 after a sharp breakout, while PAXG is consolidating just below its summer highs.
This Bitcoin vs PAX Gold comparison lines up both charts side by side to see which setup looks stronger heading into the next few weeks.
Market data was checked on September 9, 2026, at 06:52 UTC.
Bitcoin vs PAX Gold: Market Overview
Metric | Bitcoin (BTC) | PAX Gold (PAXG) |
Price | $79,032.82 | $4,397.92 |
24h Change | +0.75% | +1.01% |
Market Cap | $1.58T | $1.9B |
FDV | $1.65T | $1.9B |
24h Volume | $27.6B | $171.0M |
Vol/Mkt Cap (24h) | 1.71% | 8.98% |
Total Supply | 20.08M BTC | 432.5K PAXG |
Max Supply | 21M BTC | Uncapped |
Circulating Supply | 20.08M BTC | 432.5K PAXG |
Source: Data from CoinMarketCap as of September 9, 2026, at 06:52 UTC-3. Figures may vary slightly across other tracking websites.
Bitcoin Price Prediction Technical Analysis
Pair: BTC/USD · Market: Spot (Crypto) · Exchange: Composite · Timeframe: 1D · Source: TradingView (EMA, RSI) · Timestamp: September 9, 2026, 06:52 UTC-3
BTC is trading at $79,032.82, up 0.75% on the day, after breaking out of a multi-week base in late August and rallying sharply before pulling back to consolidate in the high-$70,000s.
Price is holding above both EMAs, with EMA20 at $77,097.46 and EMA50 at $72,543.86 acting as support well below current levels.
RSI sits at 61.68, with its average at 68.17, firmly in bullish territory but not yet stretched into overbought.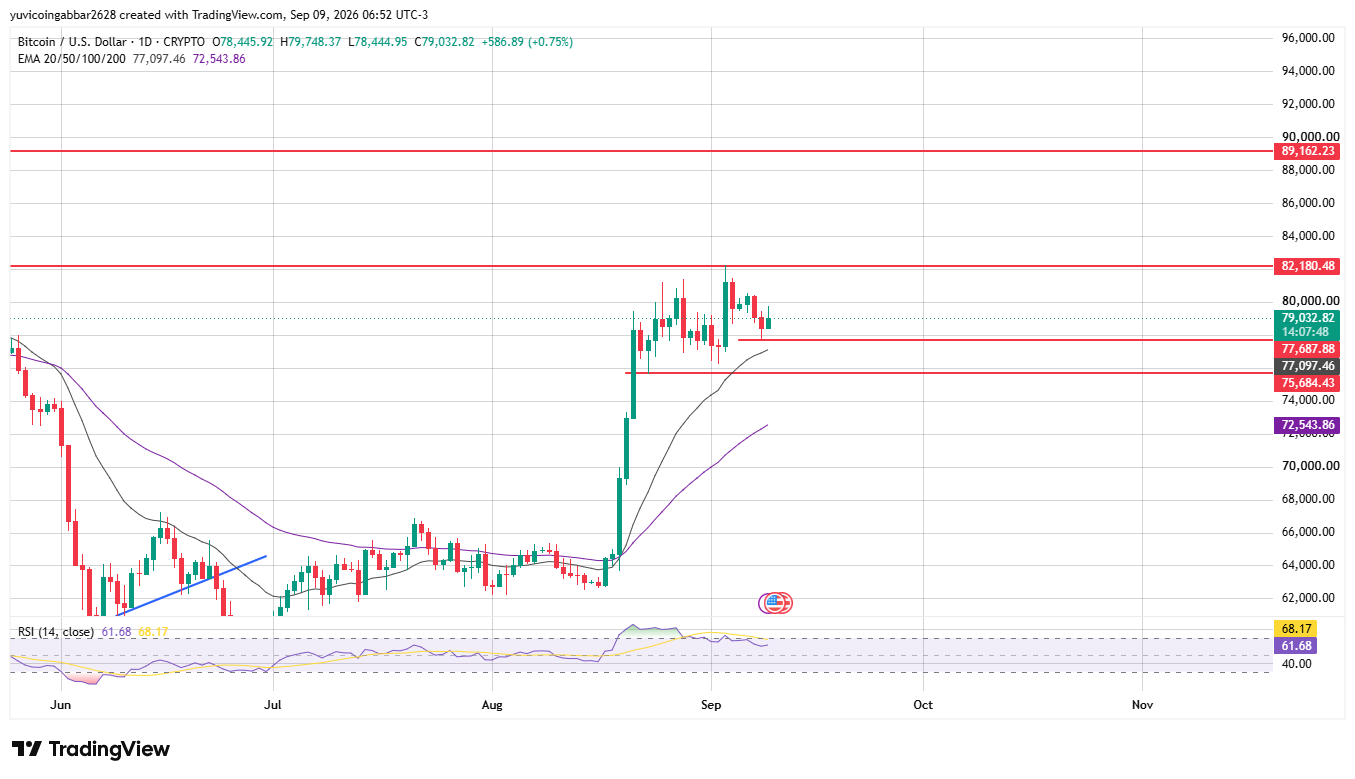
$BTC Price Today: Key Levels
Level Type | Price |
Resistance 2 | $89,162.23 |
Resistance 1 (nearest) | $82,180.48 |
Immediate Price Reference | $79,032.82 |
First Confirmed Support | $77,687.88 |
Deeper Support | $75,684.43 |
PAX Gold Price Prediction Chart: Technical Analysis
Pair: PAXG/USD · Market: Spot (Crypto) · Exchange: Composite · Timeframe: 1D · Source: TradingView (EMA, RSI) · Timestamp: September 9, 2026, 06:44 UTC-3
PAXG is trading at $4,397.92, up 0.5% on the day, consolidating below both EMAs after pulling back from its August highs near $4,674.
Price is squeezed between EMA50 at $4,369.24 as support and EMA20 at $4,431.64 as resistance.
RSI sits at 48.04, with its average at 50.79, right in neutral territory, showing no strong directional bias.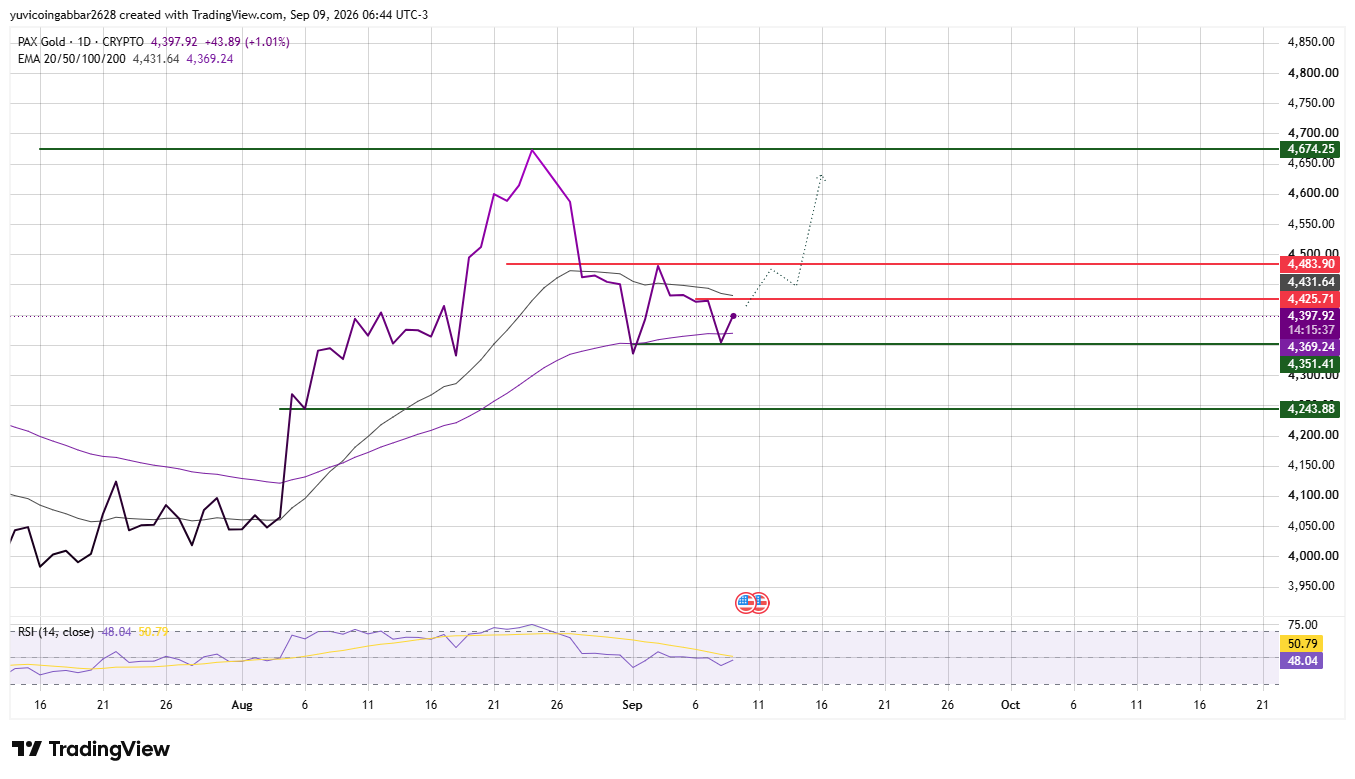
Gold Future Price: Key Levels
Level Type | Price |
Resistance 3 | $4,674.25 |
Resistance 2 | $4,483.90 |
Resistance 1 (nearest) | $4,425.71 |
Immediate Price Reference | $4,397.92 |
First Confirmed Support | $4,351.41 |
Deeper Support | $4,243.88 |
Bitcoin vs PAX Gold: Which Setup Looks Stronger?
Bitcoin Price Prediction 2026: BTC is trading above both its EMAs with RSI in bullish territory but not overbought, which usually points to room left to run before the setup gets stretched.
Holding above $77,687.88 keeps the structure intact, with $82,180.48 as the next test on the way to $89,162.23. Losing the EMA20 at $77,097.46 would be the first sign of trouble.
PAX Gold Price Prediction 2026: PAXG is caught between its EMAs, which is a more indecisive setup than Bitcoin's right now.
A reclaim of $4,425.71 and EMA20 at $4,431.64 would tilt momentum bullish toward $4,483.90 and $4,674.25, but a break below $4,351.41 would open the door to $4,243.88. Neutral RSI means either direction is realistic here.
Bitcoin vs PAX Gold: Which Setup Looks Stronger This Week?
On pure chart structure, Bitcoin currently looks like the stronger setup; it's holding above both EMAs with a bullish-but-not-overbought RSI, while PAXG is still deciding direction inside a tight EMA squeeze.
That said, the two assets serve different roles in a portfolio: BTC carries higher volatility and higher potential upside as a risk asset, while PAXG tracks physical gold and tends to behave more like a hedge, with lower day-to-day swings and a role tied to broader macro sentiment rather than crypto-specific catalysts.
Which setup fits better ultimately depends on whether the goal is momentum exposure or portfolio stability.
This comparison lays out the technical picture, not a recommendation either way.
Disclaimer
This piece is for informational purposes only and isn't financial advice. The levels and comparisons above are based on technical chart analysis and publicly available data at the time of writing, and crypto and gold markets can both move sharply within hours or days, so past patterns don't guarantee future outcomes. It's worth doing independent research and considering your own risk tolerance before acting on any of the levels discussed here.
Also read:

















