Don’t Miss $BEAT Next Breakout, Rally Ahead: Audiera Price Prediction!


Audiera (BEAT) is down sharply today, and traders are watching closely to see whether this is a pullback inside a bigger uptrend or the start of a deeper slide.
This Audiera price prediction looks at BEAT's current channel structure and whether the coin can recover in the next few days or keep falling.
Over the short term, the bullish case stays alive only if BEAT clears $1.0565 and trades above both key EMAs, while a break below the current channel would open the door to a move toward $0.8628 and lower.
Here's what the chart shows.
Market data was checked on August 13, 2026, at 10:56 IST.
Audiera Price Prediction Today: Market Overview
Metric | Value |
Price | $0.9751 |
24h Change | -10% |
Market Cap | $321.99M |
Unlocked Market Cap | $321.99M |
FDV | $973.84M |
24h Volume | $126.7M |
Vol/Mkt Cap (24h) | 39.36% |
Liq/Mkt Cap | 0.75% |
Total Supply | 1B BEAT |
Max Supply | 1B $BEAT |
Circulating Supply | 330.51M $BEAT |
Source: Data from CoinMarketCap as of August 13, 2026, at 10:56 IST. Figures may vary slightly across other tracking websites.
BEAT Price Prediction Chart: Technical Analysis
Pair: BEAT/USD · Market: Spot (Crypto) · Exchange: Aggregated crypto index (as shown on chart) · Timeframe: 1H · Source: TradingView · Timestamp: August 13, 2026, 10:56 UTC+5:30
BEAT is trading at $0.9751, after breaking out of an earlier ascending trendline and then sliding into a fresh descending channel that has formed since the recent high near $1.2028.
Price is currently testing the lower edge of that channel, right above the $0.8628 support.
Both EMAs (Exponential Moving Average, a momentum indicator that weights recent candles more heavily) sit well above the current price, with EMA 20 at $1.0868 and EMA 50 at $1.2293, meaning they're currently acting as resistance rather than support.
Whether BEAT stays inside this channel or breaks out of it is the key question over the next few sessions.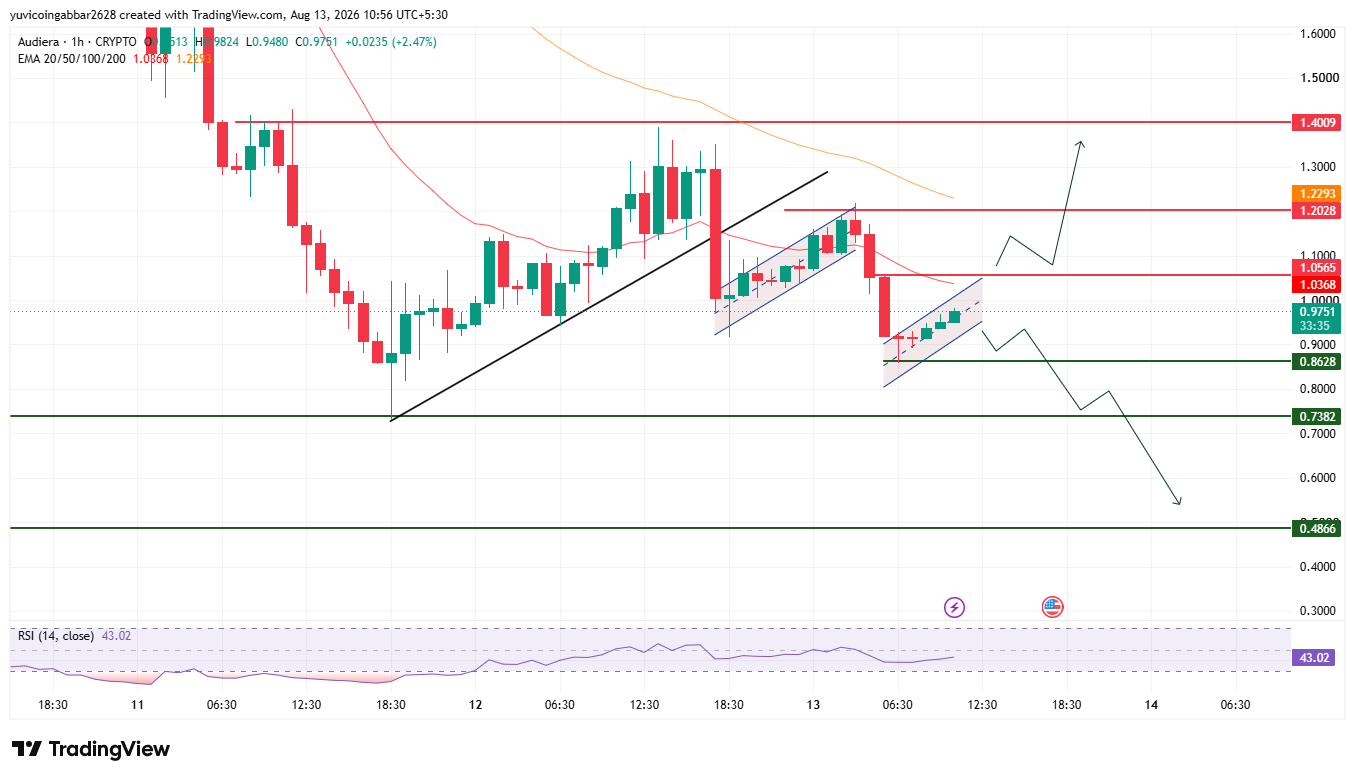
BEAT Support and Resistance Levels
Level Type | Price |
Resistance 3 | $1.4009 |
Resistance 2 | $1.2028 |
Resistance 1 (nearest) | $1.0565 |
Immediate Price Reference | $0.9751 |
First Support | $0.8628 |
Deeper Support | $0.7382 |
Structural Floor | $0.4866 |
EMA Levels
EMA | Price |
EMA 20 | $1.0868 |
EMA 50 | $1.2293 |
Audiera Price Prediction: Bull Case vs Bear Case
$BEAT price target 2026 Bull Case: If the price sustains at the current level and breaks above the channel resistance near $1.0565 and then goes on to trade above both the EMA 20 at $1.0868 and the EMA 50 at $1.2293, the upper levels to watch are $1.2028 and $1.4009.
Holding above these EMAs would support the idea that the recent drop was just a pullback within a larger uptrend rather than a trend reversal.
$BEAT price target 2026 Bear Case: If it breaks below the channel and loses the $0.8628 support instead, the price can move toward the lower levels at $0.7382 and eventually $0.4866.
Staying below both EMAs would confirm sellers remain in control and that the channel breakdown is more than a temporary dip.
$BEAT Price Target: Can $BEAT Reach $1.4009?
$1.4009 is the highest resistance level marked on the chart.
Reaching it would require $BEAT to first break out of the current descending channel, clear the EMA 20 and EMA 50 levels near $1.0868 and $1.2293, and then push through $1.2028 before making a final run at $1.4009.
That's a multi-stage recovery, not a single move, and it depends on the channel breakout holding rather than fading.
What Could Invalidate the Bullish Setup?
A rejection at the channel resistance near $1.0565, followed by a close back below the $0.8628 support, would put the recovery case in doubt.
A deeper break through $0.7382 and the structural floor at $0.4866 would suggest the descending channel is continuing rather than reversing and that the pullback thesis has failed.
Audiera Price Prediction: Expert View
According to CoinGabbar analysts, BEAT has slipped into a descending channel after topping out near $1.2293, and the coin is now testing channel support just above $0.8628.
Both EMAs sitting well above the current price show sellers still have the edge in the near term, and a real trend change needs a clean break above the channel with the price holding over both EMA lines.
Until that happens, the safer read is that BEAT stays range-bound to lower within the channel. A break either side of this channel is likely to set the tone for the next leg.
Disclaimer: This piece is for informational purposes only and isn't financial advice. The levels and scenarios above are based on technical chart analysis and publicly available data at the time of writing, and crypto markets can move sharply within hours, so past patterns don't guarantee future outcomes. It's worth doing independent research and considering your own risk tolerance before acting on any of the levels discussed here.
Also read:

















