Wiki Cat Price Prediction: Can $WKC Hit $0.0000002 Next?


A meme coin post about a 923 dollar bag turning into 84,000 dollars just went semi-viral, and WKC pumped right alongside it. Is this a real breakout or just another meme-coin sugar rush? Here's what the chart, the wallets, and the numbers actually say.
Why Wiki Cat Is Trending Right Now
Wiki Cat price prediction conversations are picking up because WKC is up roughly 23% in the last 24 hours and near 20% on the week. Right now, the coin is trading close to $0.0000001129, with a 24-hour range between $0.00000009021 and $0.0000001179, according to CoinMarketCap data showing Wiki Cat trading around $0.06₁129, up 23.13% over 24 hours. taken at 16:56 IST (11:26 UTC) on August 18, 2026.
Why Is WKC Price Moving Today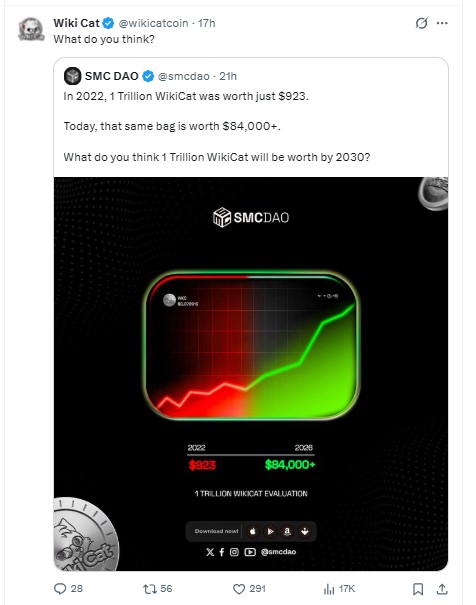
The most visible catalyst appears to be social-media attention rather than a new fundamental development. WikiCat's own account reposted a viral chart claiming 1 trillion WKC went from 923 dollars in 2022 to over 84,000 dollars today, asking followers what it might be worth by 2030.
That post picked up nearly 300 likes and thousands of views fast. And retail attention like that tends to show up in the order book within hours, not days.
But the pump isn't hype alone. Price also broke above a multi-week consolidation zone on rising volume, which gives the move some technical backing. Turns out, sentiment and structure lined up at the same time, and that combination is usually what triggers a real leg up rather than a one-candle spike.
Where Is Wiki Cat Price Right Now
Market cap sits near $60.52M with 24-hour volume of $763.63K, a volume-to-market-cap ratio of about 1.16%. FDV is close to market cap at $62.46M, and liquidity-to-market-cap comes in at 2.19%.
The circulating supply is 535.88 trillion WKC against a max supply of 553 trillion, so dilution risk is low since almost all supply already trades. The holder count stands at 174,068 wallets, as of BSCScan.
Wiki Cat Leads the 24-Hour Top Gainers List
WKC currently sits at the top of the broader top gainers board, up 25.72% over 24 hours. That puts it ahead of NITRO (+19.25%), BULL (+16.85%), XAVIER (+16.44%), SCAM (+15.95%), ANSEM (+15.75%), PEP (+13.65%), CRASH (+13.04%), TUT (+12.41%), and JOBY (+9.14%).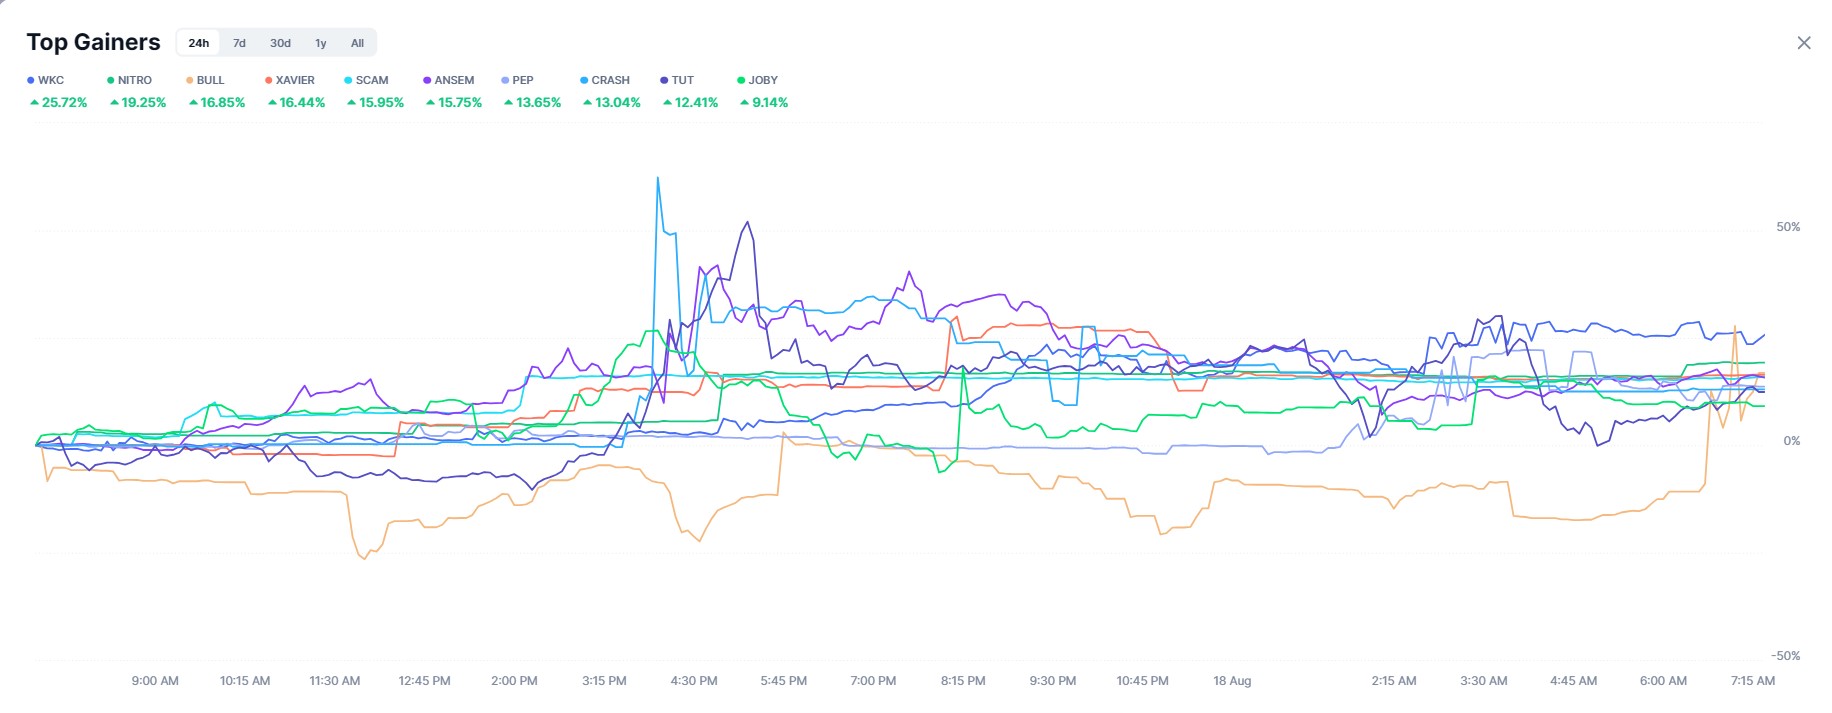
What stands out isn't just the rank. Looking at the intraday lines, coins like SCAM and ANSEM spiked hard past 50% and then faded back toward the pack, while BULL spent most of the day underwater. WKC's line, by comparison, climbed in a steadier, more gradual push through the afternoon and evening before leveling off.
That kind of grind tends to hold up better than a spike-and-fade pattern. It won't guarantee continuation, but it does line up with the higher-low structure already forming on the daily and weekly charts covered below.
Wiki Cat Daily Chart Analysis
On the daily WKC/USDT chart, trades spent from April through July grinding lower inside a descending channel, with each bounce capped by a falling upper trendline. That channel gave way in early August, and Price then spent several weeks building a tight consolidation box just above the old channel floor before clearing it on rising volume.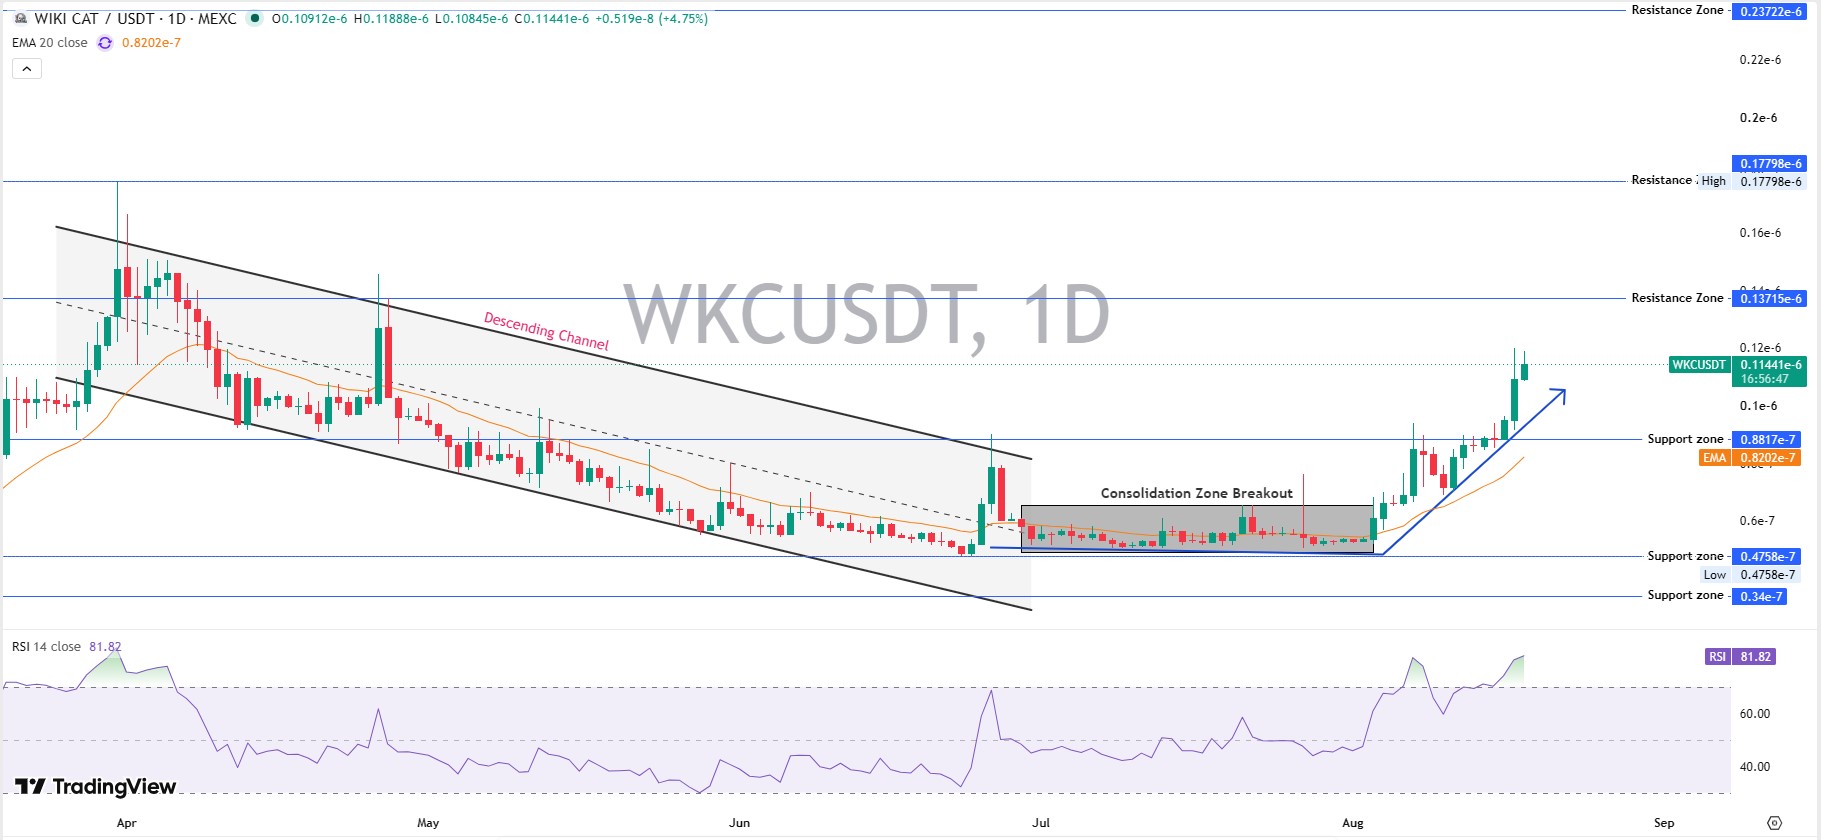
That consolidation breakout matters more than the pump itself. Sideways bases that resolve upward on volume tend to hold better than vertical spikes with nothing behind them, and this one had both a base and a volume pickup.
The latest daily candle prints an open near $0.00000010912, a trade high of $0.00000011888, and a low of $0.00000010845, putting the session around 4.75% higher. RSI 14 is reading 81.82, deep in overbought territory. That doesn't mean a reversal is coming, but it does mean recent trades have leaned heavily one-sided, and a short-term cool-off toward the $0.00000008202 EMA20 wouldn't be shocking even inside an intact uptrend.
Nearby resistance sits at $0.00000013715, then a prior high near $0.00000017798, and a heavier zone at $0.00000023722 above that. Those three levels are the daily chart's next real tests.
Wiki Cat Weekly Chart Analysis
Zoom out and the story slows down. The weekly TradingView chart shows a descending triangle stretching back roughly a year, built from a flat support near $0.00000008817 to $0.00000004758 on one side and a series of lower highs pressing down from above on the other. 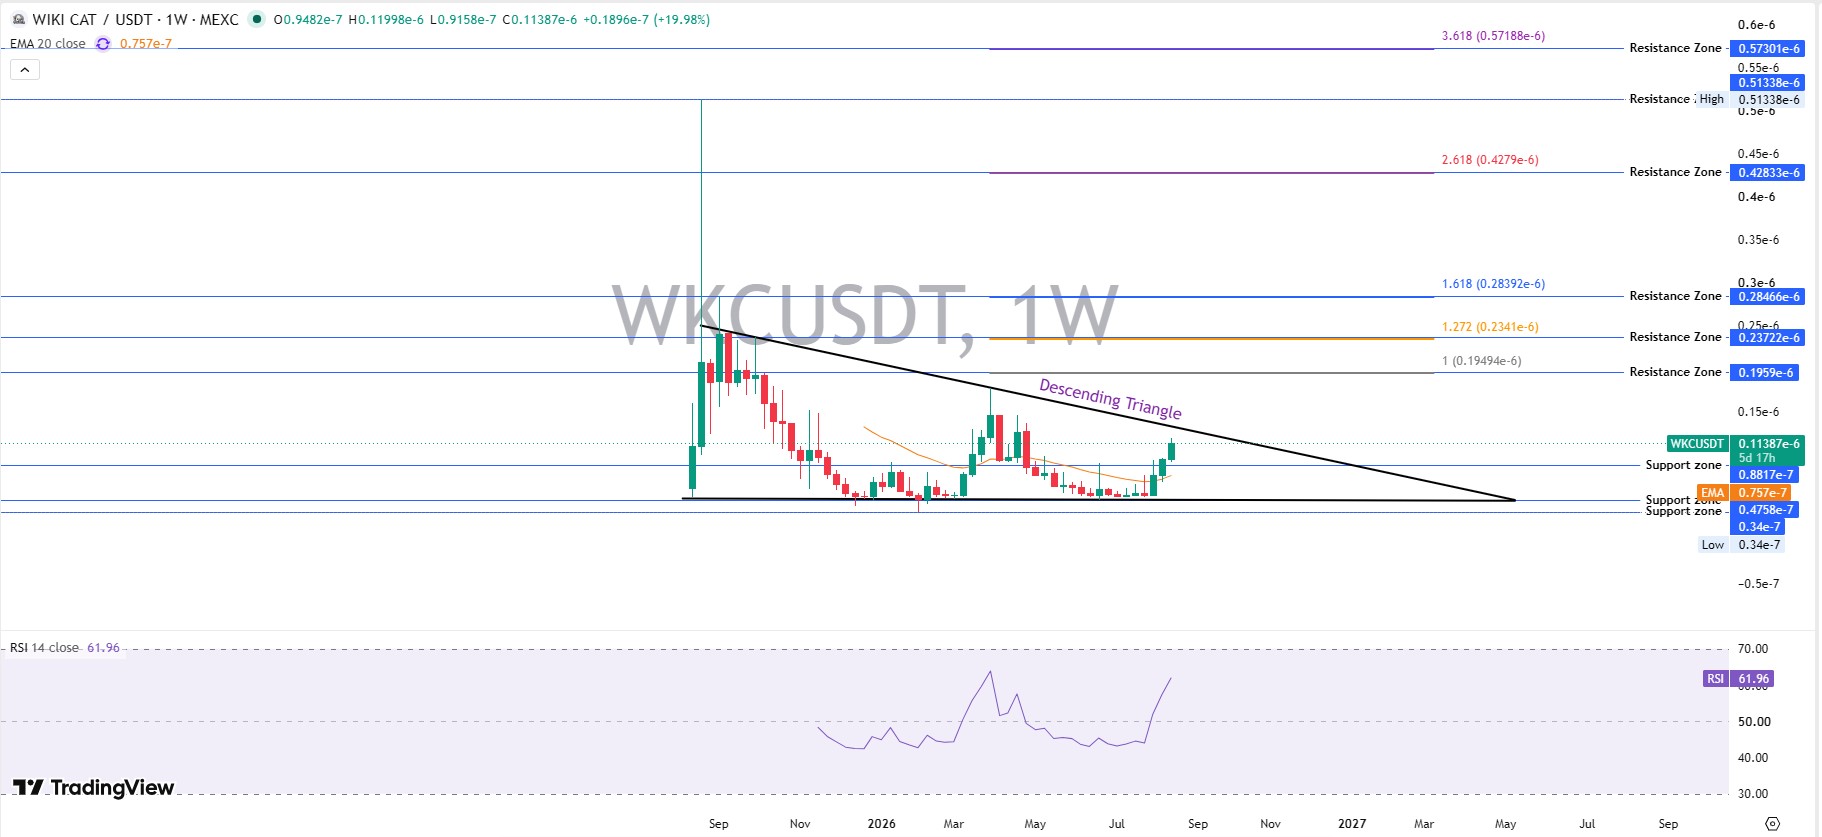
Triangles like this usually resolve in the direction of the eventual breakout, and this week's candle broke above that descending trendline on a near-20% gain, with a trade high of $0.00000011998.
Weekly RSI 14 sits at 61.96, well below overbought. That's worth sitting with for a second: the daily chart looks stretched, but the weekly chart still has room. When timeframes disagree like that, it usually means the bigger trend is intact even if a short-term pullback shows up first.
Price is also trading above the weekly EMA20 of $0.0000000757, another point in favor of the broader uptrend. Fibonacci extensions are drawn from the prior swing project resistance at $0.0000001959, then $0.0000002341, $0.0000002847, and further out toward $0.0000004283 and $0.0000005730 if this breakout has real staying power over the coming months.
Key Support and Resistance Levels
Support: $0.00000008817 (near-term), $0.00000008202 (weekly EMA20), $0.00000004758 (deeper support), and $0.0000000340 (worst-case floor).
Resistance: $0.00000013715, $0.00000017798, $0.00000023722, with weekly Fibonacci extensions layered above that toward $0.00000057301.
Wiki Cat Tokenomics and Supply
WKC's tokenomics documentation outlines a fixed max supply of 553 trillion tokens, with the bulk already in circulation. That's unusual for a meme coin; there isn't a large future unlock hanging over the price the way there is with newer presale tokens.
A big chunk of that supply, over 300 trillion tokens, sits in a burn address according to on-chain supply and burn records. That's roughly 35.9% of total supply permanently removed from trading, which is a genuine deflationary lever rather than a marketing line.
Whale and Holder Concentration
Pulling wallet data from BscScan's holder breakdown, the top 100 holders control 56.06% of supply, and the Gini score sits at 0.9637, a high concentration reading.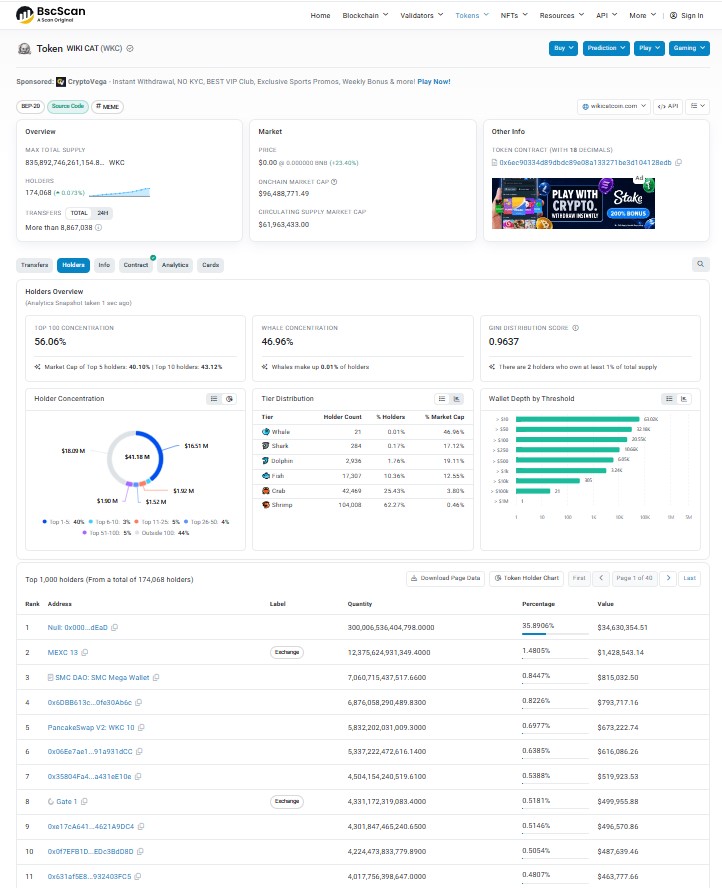
Here's the thing though: the top wallets aren't all individual whales. Address #2 is a MEXC exchange wallet, and #5 is a PancakeSwap liquidity pool, not a person sitting on a dump button. Once you separate exchange and pool wallets from actual whale-tier holders (21 wallets holding 46.96% of the token supply), the concentration risk looks real but slightly less alarming than the headline number implies.
Liquidity Snapshot
Liquidity-to-market-cap runs at 2.19%, and daily volume turns over only about 1.16% of market cap. That's thin. Thin liquidity means relatively small trades can move price sharply in either direction, which partly explains today's outsized percentage swing.
Wiki Cat as a Meme Coin: What That Means for Price
Wiki Cat is a BNB Chain-based meme coin, and that label matters for how you read this rally. Meme coin price action leans on community virality, exchange visibility, and timing far more than on product roadmaps or revenue.
The 84,000-dollar repost is an example: no protocol upgrade, no partnership, just a number that made people stop scrolling. That works until it doesn't. When the next viral post fails to land, momentum can fade just as fast as it built, so treat strength here as sentiment-driven rather than fundamentals-driven.
Wiki Cat Price Prediction: Bear, Base and Bull Scenarios
Timeframe | Bear Case | Base Case | Bull Case | Probability | Invalidation |
7 Days | $0.000000082–0.000000088 | $0.000000100–0.000000130 | $0.000000140–0.000000178 | Bear 25% / Base 45% / Bull 30% | A full day of trading below $0.000000088 |
30 Days | $0.000000060–0.000000080 | $0.000000120–0.000000180 | $0.000000230–0.000000280 | Bear 30% / Base 40% / Bull 30% | A full week of trading below the $0.0000000757 weekly EMA20 |
Early 2027 | $0.000000040–0.000000050 | $0.000000300–0.000000400 | $0.000000450–0.000000570 | Bear 25% / Base 45% / Bull 30% | Loss of the higher-low structure that started with the August 2026 breakout |
This Wiki Cat price prediction table leans on the technical structure above, not on the viral post alone. The base case simply assumes the breakout holds without fresh catalysts. The bull case needs sustained volume and probably another round of social attention to reach those Fibonacci extension zones. And the bear case would need weekly support to fail outright, which hasn't happened yet.
Key Risks to Watch
Whale and pool concentration: a Gini score of 0.9637 means a small number of wallets can still swing the price.
Thin liquidity: a 2.19% liquidity-to-market-cap ratio amplifies both pumps and dumps.
Sentiment dependency: as a meme coin, WKC needs continued social engagement to sustain moves; interest can fade quickly once broader crypto news cycles shift attention elsewhere.
Macro and regulatory backdrop: developments like Fed policy meetings or shifts around the Clarity Act discussions can pull risk appetite away from small-cap meme coins fast.
Disclaimer
This article is for informational purposes only and isn't financial advice. Cryptocurrency markets, especially meme coins like WKC, are highly volatile, and prices can move sharply in either direction. Do your own research and consider your own risk tolerance before making any trading decisions. Past performance, including any figures cited from social media posts, doesn't guarantee future results.
Also read:







.webp)








