XRP Breaks Out on Clarity Act Optimism, But the Charts Stay Cautious

XRP price is holding above a key resistance zone this week, and traders are watching to see if the rally has more room to run.
In the latest XRP news, the token broke out of a multi-week triangle pattern and climbed past $1.13, a level that had capped gains for weeks.
The altcoin trades near $1.14 at the time of writing, up 1.5% on the day after briefly touching $1.16 on Tuesday, July 21.
Chart watchers, on-chain data, and fresh ETF inflows are all pointing to renewed interest in the market, even as some indicators flash overbought warnings.
What is the XRP price today?
The altcoin is priced at $1.1404, up 1.5% over the past 24 hours. Market cap sits at $71.17 billion, keeping it among the largest tokens by that measure.
Here is a snapshot of the key Ripple price today numbers.
Metric | Value |
Price | $1.1404 |
24h Change | +1.5% |
Market Cap | $71.17B |
Futures Volume (24h) | $2.40B |
Spot Volume (24h) | $400.89M |
Open Interest | $2.52B |
Circulating Supply | 62.46B |
Derivatives data shows traders leaning long, with Binance's long/short account ratio at 2.46.
Why is XRP price up today? XRP Latest News
The altcoin cleared its $1.130 resistance zone on the 4-hour chart with a move of roughly 3%, ending weeks stuck inside a tightening triangle. That breakout is the biggest piece of Ripple news today, driving trader attention.
Price has held above short-term moving averages near $1.12 since the move. The RSI pushed toward 69, a sign of strong momentum, though it also sits close to overbought territory.
A short pullback here would not be unusual.
Liquidation data leans bullish too. Short positions worth $3.24 million were wiped out in the past 24 hours, more than six times the $468,060 in liquidated longs, a sign shorts got caught off guard by the move.
XRP price forecast: Will XRP hit $1.30?
If the price holds above $1.130, traders are watching $1.18 as a local high, then $1.20 as major resistance, and $1.29 to $1.30 once the breakout is confirmed. That range is now the near-term XRP price forecast most chart watchers are circulating.
Independent chart tracker Ali Charts flagged the same $1.30 target after the breakout on its 1-hour chart, calling it confirmed.
On the downside, a drop below $1.1430 and then $1.12 could send price back to retest $1.08. A failed breakout could even expose the $0.94 to $0.91 zone.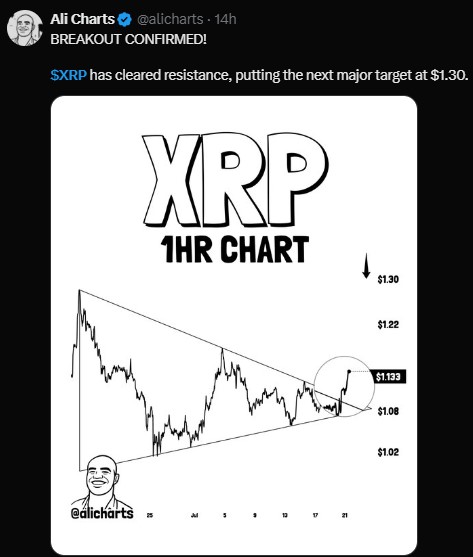
Are XRP whales buying or selling right now?
On-chain data from Santiment shows a split between big and small holders.
Wallets holding between 100,000 and 100 million have added 2.8% more coins over the past five weeks.
Smaller wallets holding under 0.01 cut their holdings by 5.2% over the same stretch.
Santiment noted that the altcoin price has historically tracked the behavior of larger holders more closely than the smallest retail wallets, which supports the case for the bounce above $1.16.
The setup lines up with Ripple's resolved SEC overhang and growing XRPLedger use in payments and tokenization, keeping institutional eyes on the token.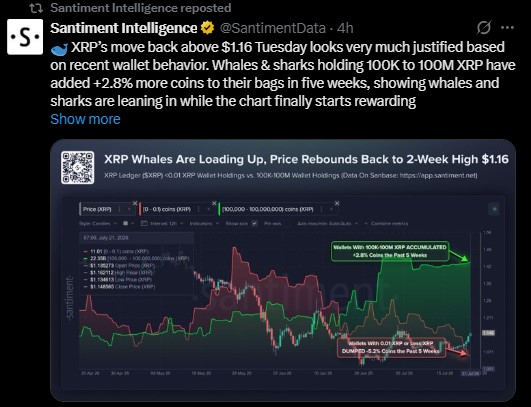
Ripple XRP news today: What's driving the XRP Ledger?
Spot ETFs had a bullish start to the week, adding to the latest Ripple news cycle. The Ripple ETF brought in $5.66 million in net inflows on Tuesday, while other issuers stayed flat.
Total assets under management across spot ETFs sit near $1.06 billion, though inflows remain well below levels seen in April and May.
Separately, RippleX says agentic transactions on the XRPLedger, which crossed the 1 million mark this month, are on pace to hit 10 million soon.
The growth reflects rising developer interest in using the XRP Ledger for AI agents that pay for data, computing power, and other services without human involvement — a trend likely to keep showing up in Ripple news today and in the weeks ahead.
Will The Clarity Act Pass in 2026
On Polymarket, odds of the Clarity Act being signed into law in 2026 have moved higher this week. The prediction market shows the probability near 47%, though down slightly on the day, after climbing from about 32% on Friday.
The jump followed reports that President Trump had reportedly agreed to advance some version of an ethics provision that had previously stalled the bill in Congress.
For Altcoin holders watching Clarity Act as a potential catalyst, the shift in betting-market sentiment adds another data point, even as the odds remain below 50% and well off earlier-year highs near 75-80%.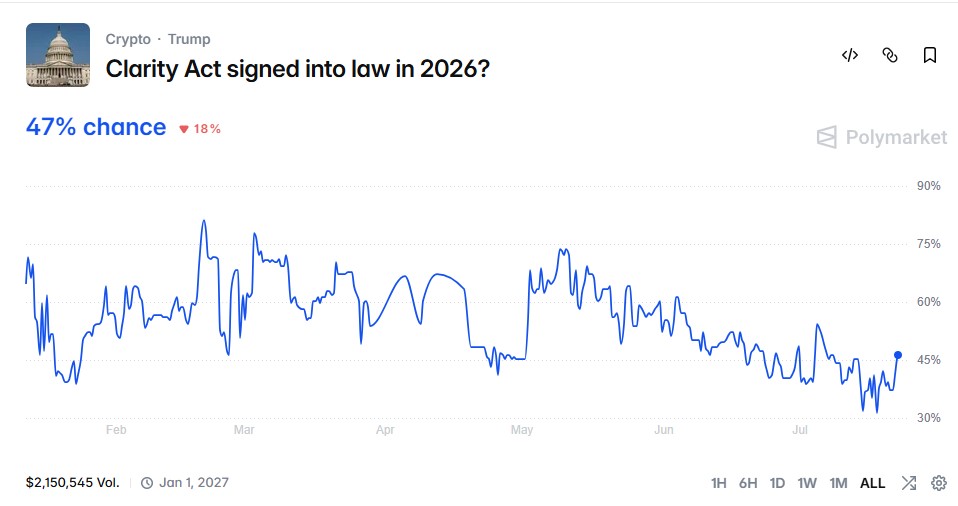
XRP price prediction 2026: Long-term forecast
Beyond the short-term chart, some analysts are mapping a longer path for their Ripple price prediction 2026.
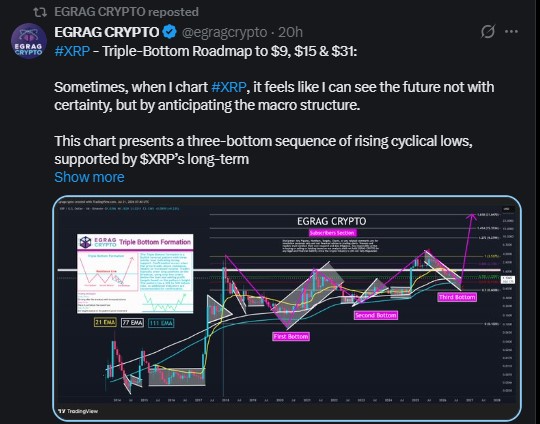
Crypto chart account EGRAG CRYPTO points to a triple bottom pattern on the monthly chart, with a third bottom forming near $0.90 to $1.00.
The roadmap includes an initial reclaim near $1.23, structural confirmation around $1.56, and a breakout zone between $2.38 and $3.54.
Beyond that, Fibonacci extension levels point to $9.28, $15.35, and $31.65 as long-term upside targets, based on the 21, 77, and 111 EMAs that have marked prior cycle bottoms.
These figures are chart-based projections tied to a pattern that has not been fully confirmed. EGRAG CRYPTO's own notes describe the setup as offering strong risk-to-reward rather than a certain outcome.
Level | Price | Type |
Local high | $1.18 | Near-term resistance |
Major resistance | $1.20 | Near-term resistance |
Breakout target | $1.29 - $1.30 | Near-term resistance |
Support retest | $1.08 | Near-term support |
Liquidity zone | $0.91 - $0.94 | Near-term support |
Structural confirmation | $1.56 | Long-term target |
Major breakout zone | $2.38 - $3.54 | Long-term target |
Fibonacci 1.272 | $9.28 | Long-term target |
Fibonacci 1.618 | $31.65 | Long-term target |
No target on this list is guaranteed. The price has swung wildly before, and chart patterns can fail without warning.
Disclaimer
This article is for informational purposes only and does not constitute financial advice. Cryptocurrency markets are highly volatile, and prices can rise or fall sharply within short periods. The price levels and long-term targets mentioned are based on chart patterns and third-party analysis, not guaranteed outcomes. Always do your own research and consult a licensed financial advisor before making investment decisions.
Also read:

















