XRP Price Prediction 2027: Can XRP Kick Off a New Bull Run?

Updated: July 23, 2026
Change Note: This XRP price prediction 2027 update adds refreshed technical levels, a four-phase price outlook, RSI analysis, analyst targets, monthly scenarios, and a bridge to the XRP price prediction 2028 outlook.
Refresh Cadence: Weekly for technical levels and market data; monthly for the broader outlook.
XRP Price Prediction 2027: Can XRP Kick Off a New Bull Run?
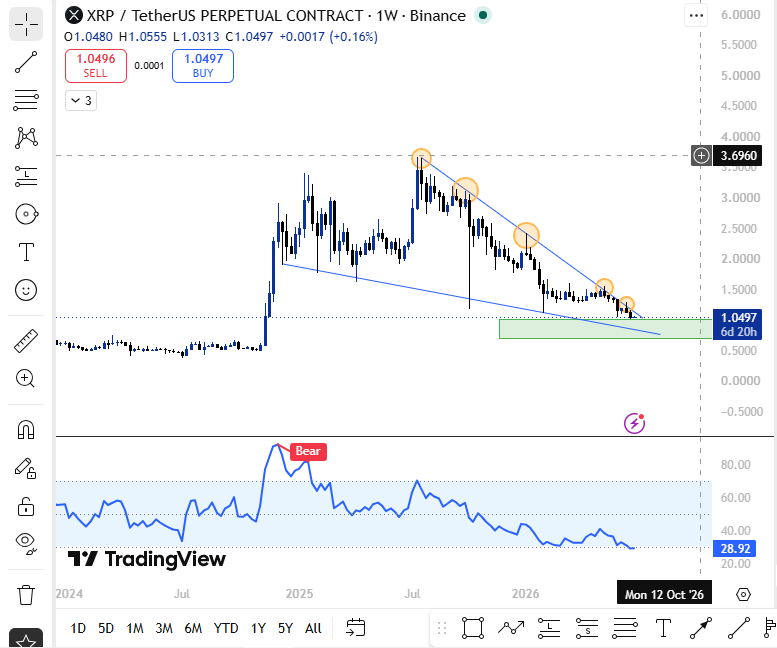
$XRP is trading near $1.04, and the current chart does not look exciting. Weekly candles remain under pressure, while the token has fallen sharply from its previous high near $3.69.
However, the setup is becoming technically interesting as its approaches the $1.00 psychological support zone.
For the price prediction 2027, the key question is whether the current compression can develop into a sustained breakout.
A potential pole-and-flag structure, deeply oversold weekly RSI, and broader crypto-cycle expectations could influence the next major move.
The XRP forecast 2026 is equally important because the second half of 2026 could determine whether it enters 2027 with bullish momentum or remains trapped below key resistance.
The current outlook is conditional. A sustained breakout above $1.25–$1.30 could strengthen the bullish thesis, while a weekly close below $0.87 would weaken the setup.
$XRP Technical Analysis: Why the $1.00 Level Matters
Three things are happening on the weekly chart at the same time. A potential pole-and-flag pattern is compressing, RSI has dropped below 30, and price is sitting near the $1.00 psychological level.
The round-number support is closely watched by retail traders, institutions, and algorithms. However, support and resistance levels must be confirmed by weekly closes and trading volume rather than price alone.
The wider technical analysis also shows a key resistance zone between $1.25 and $1.30. A weekly close above this area with stronger volume could confirm a breakout attempt. Conversely, losing $0.87 would invalidate much of the current bullish structure.
$XRP Quantum News and Institutional Adoption: What Could Change?
On June 23, 2026, President Trump signed the Quantum Executive Orders. The broader crypto market initially paid limited attention, but the development has renewed discussion about blockchain security and future institutional adoption.
Claims that the $XRP Ledger could become a leading quantum-resistant blockchain by 2028 remain an important narrative to monitor, but they should not be treated as a guaranteed price catalyst.
For the future price, institutional adoption could become more important if the network demonstrates real-world utility, stronger security standards, and increasing payment activity. The quantum narrative may support the long-term story, but actual adoption and capital inflows would ultimately matter more.
$XRP Price Prediction 2027: Can the Pole-and-Flag Pattern Break Out?
The XRP/USDT weekly chart appears to show a potential pole-and-flag structure. The pole represents the strong move from late 2024 into early 2025, when it climbed toward $3.69. The subsequent correction developed within a descending channel, creating the potential flag.
The pattern is now compressing near the $1.00 area. If it breaks above the upper trendline around $1.25–$1.30, the measured move could point toward approximately $3.50–$5.00.
This does not guarantee that will reach those levels. Pattern failures are common, and confirmation requires price and volume support.
So, how high can it go if the breakout succeeds? The technical measured move points toward $3.50–$5.00, while stronger Fibonacci levels and a broad crypto bull market could potentially push it toward $5–$7.
The price target 2026 remains closely linked to the $1.00–$1.30 range. A successful breakout in 2026 could establish the foundation for stronger 2027 targets, while a breakdown could delay the bullish cycle.
$XRP RSI Analysis: Is Selling Pressure Losing Momentum?
The weekly RSI for XRP is around 28.92, placing the indicator in oversold territory.
More importantly, price is making lower lows while RSI is showing signs of forming higher lows. This potential bullish divergence suggests that downside momentum may be weakening, although it does not guarantee an immediate reversal.
Historically, it has experienced strong rallies after periods of extreme weakness, but previous performance does not guarantee future results. Traders should therefore watch whether RSI recovers above 45–50 alongside increasing volume.
This makes RSI, moving averages, volume, and momentum important indicators for confirming any future breakout.
$XRP Price Forecast 2026: The Bridge to 2027
The $XRP price forecast 2026 is critical to the 2027 outlook. If it closes 2026 above major resistance with stronger trading volume, the 2027 bull case becomes more credible.
A weekly close above $1.25–$1.30 could confirm a structural improvement, while a breakdown below $0.87 would weaken the thesis and potentially expose it to the $0.60–$0.70 region.
The XRP price prediction 2026 therefore acts as the bridge between the current accumulation phase and the potential 2027 bull cycle.
Four Phases: Where Could $XRP Go Next?
Phase 1 — June to August 2026: $0.87–$1.10
XRP remains near $1.00, with $0.87 acting as the key downside support. Until price closes meaningfully above $1.20, this phase remains focused on accumulation and confirmation.
Phase 2 — September to November 2026: $1.20–$2.00
A breakout from the descending flag, rising volume, and RSI recovery could push it toward $2.00 if Bitcoin and the broader crypto market strengthen.
Phase 3 — December 2026 to February 2027: $2.50–$4.00
If the breakout is confirmed, institutional interest and broader market momentum could accelerate. The potential ETF approval impact and stronger institutional adoption could also support demand.
Phase 4 — March to June 2027: $4.50–$7.00
This represents the speculative bull-run scenario. It would require a strong Bitcoin cycle, expanding crypto liquidity, increased demand, and continued capital rotation into large-cap altcoins.
This raises the question: will XRP reach $5? A move to $5 would require sustained resistance breaks, stronger volume, institutional demand, and a supportive crypto cycle. It is possible under a bullish scenario but is not guaranteed.
XRP Halving-Cycle Correlation: Does Bitcoin's Cycle Matter?
Unlike Bitcoin, it does not have a halving event that automatically reduces new supply. However, the XRP halving-cycle correlation is often discussed in relation to broader Bitcoin-led market cycles.
Historically, it has often benefited when Bitcoin liquidity expands and capital rotates into altcoins. Therefore, XRP's 2027 outlook may depend more on Bitcoin's cycle, overall crypto liquidity, and altcoin strength than on a direct XRP halving mechanism.
$XRP Price Prediction 2027: Bull, Base and Bear Scenarios
| Scenario | $XRP Target | Probability | Key Assumption | Invalidation |
|---|---|---|---|---|
| Bear Case | $0.60–$1.20 | 25% | Flag fails and crypto liquidity weakens | Weekly close below $0.87 |
| Base Case | $1.50–$3.50 | 50% | Gradual recovery and improving market conditions | Sustained weakness below $0.87 |
| Bull Case | $4.50–$7.00 | 20% | Strong BTC cycle, ETF demand and institutional adoption | Failure to reclaim $1.30 |
| Extreme Bull | $10+ | 5% | Major crypto expansion and large capital rotation | Cycle fails to accelerate |
These scenarios provide a more balanced bull case and bear case framework rather than relying on a single fixed price target.
$XRP Price Forecast: Analyst Targets and Market Views
| Source | Target | Market View |
|---|---|---|
| Standard Chartered | ~$2.80 | Institutional forecast |
| 21Shares | $1.60 Bear / $2.45 Base / $2.69 Bull | Scenario-based outlook |
| Changelly | Model-based | Algorithmic projection |
| CoinCodex | Model-based | Algorithmic projection |
| This Analysis | $0.87–$7.00 | Technical and cycle-based scenarios |
These forecasts show why the XRP price target remains highly uncertain. Conservative models focus on technical and macro risks, while bullish projections depend on institutional adoption, ETF demand, and a favorable crypto cycle.
XRP Price Prediction 2027: Monthly Targets
| Month | Low | Average | High |
|---|---|---|---|
| January 2027 | $2.00 | $2.75 | $3.50 |
| February 2027 | $2.20 | $3.00 | $3.80 |
| March 2027 | $2.50 | $3.50 | $4.50 |
| April 2027 | $2.80 | $4.00 | $5.00 |
| May 2027 | $3.00 | $4.50 | $5.50 |
| June 2027 | $3.20 | $4.75 | $6.00 |
| July 2027 | $3.00 | $4.50 | $5.80 |
| August 2027 | $2.80 | $4.20 | $5.50 |
| September 2027 | $2.60 | $4.00 | $5.20 |
| October 2027 | $2.80 | $4.25 | $5.50 |
| November 2027 | $3.00 | $4.50 | $6.00 |
| December 2027 | $3.20 | $4.75 | $7.00 |
These are scenario-based estimates, not guaranteed monthly prices.
XRP Market Cap Potential: Can $XRP Reach $10?
The market cap potential must be considered when evaluating aggressive targets.
At roughly 61.82 billion circulating it , a $10 price would imply a circulating market capitalization of approximately $618 billion. A $5 price would imply roughly $309 billion.
Therefore, will XRP reach $10 is a much more aggressive question than whether it can recover toward $5. A $10 valuation would likely require a much larger crypto market, sustained institutional adoption, stronger ETF demand, and significant capital rotation into XRP.
This also raises the question: can XRP reach $9 by 2027, Such a move would require a much larger crypto market, strong institutional adoption, sustained ETF demand, and a powerful altcoin cycle.
Was Our Last $XRP Price Prediction Right?
The previous outlook focused on key support and resistance zones rather than a single fixed target. The current price action should be compared against those original levels.
Accuracy Log: Update this section weekly with the original forecast, actual price movement, levels reached, and invalidated scenarios. This creates a transparent record of forecast performance rather than selectively highlighting successful predictions.
XRP Bull Case and Bear Case for 2027
The bull case assumes a breakout above $1.25–$1.30, stronger Bitcoin performance, rising institutional demand, and improving liquidity. Under this scenario, it could move toward $4.50–$7.00.
The bear case emerges if it loses $0.87, the flag fails, Bitcoin weakens, or crypto liquidity declines. XRP could then revisit the $0.60–$0.70 region.
The base case assumes a gradual recovery through late 2026, followed by stronger momentum in 2027.
What to Watch Before Making Any Decision
A weekly close above $1.25–$1.30 with strong volume would strengthen the breakout thesis. A weekly close below $0.87 would invalidate the current flag structure and increase downside risk.
Traders should monitor XRP trading volume, RSI, moving averages, Fibonacci levels, ETF flows, Bitcoin liquidity, and institutional adoption.
For investors asking is it a good long term investment, the answer depends on risk tolerance, adoption, regulation, and the broader crypto cycle. No price target can remove the high volatility associated with cryptocurrency markets.
$XRP Price Prediction 2028: What Could Come Next?
The XRP price prediction 2028 will depend heavily on the outcome of the 2026–2027 cycle. A sustained breakout, stronger institutional adoption, and broader crypto expansion could create a stronger foundation for 2028. However, a failure to hold major support or a prolonged bear market could make the longer-term outlook more cautious.
Expert View
Market analysts view it as being at a critical technical phase, with a potential pole-and-flag structure, oversold RSI, and support near $1.00 creating a possible setup for recovery. However, confirmation remains essential. A sustained breakout above $1.25–$1.30 with stronger volume would provide greater confidence in the bullish thesis, while a break below $0.87 could invalidate the setup.
Disclaimer: This article covers technical analysis and market observations for educational purposes only. Nothing written here is financial advice. Cryptocurrency markets are unpredictable and highly volatile. Conduct your own research and consult a qualified financial advisor before making investment decisions.

















