Ripple $10 XRP Target: Can XRP Reach $10 or $17 After Breakout?


XRP is back in the spotlight. After a breakout that caught many traders off guard, analysts are now pointing to price targets as high as $17. Some are even looking further.
The Ripple $10 XRP target has become a major talking point among long-term investors, with different analysts placing their projections between $7 and $17 depending on their technical models and market-cycle assumptions.
The question is not just where XRP can go. It is how long most people will hold on to get there.
For anyone following the XRP price prediction today, the key debate is whether the current structure can support another major leg higher or whether $XRP needs a deeper correction first.
What Does the XRP Chart Look Like Right Now?
On the long-term chart, the altcoin has formed a clear pattern of descending triangles followed by sharp recoveries.
The most recent structure shows a false breakdown near the $0.85 to $1.00 zone, which acted as a launchpad. After that, the price surged to the $3.24 area in mid-2024.
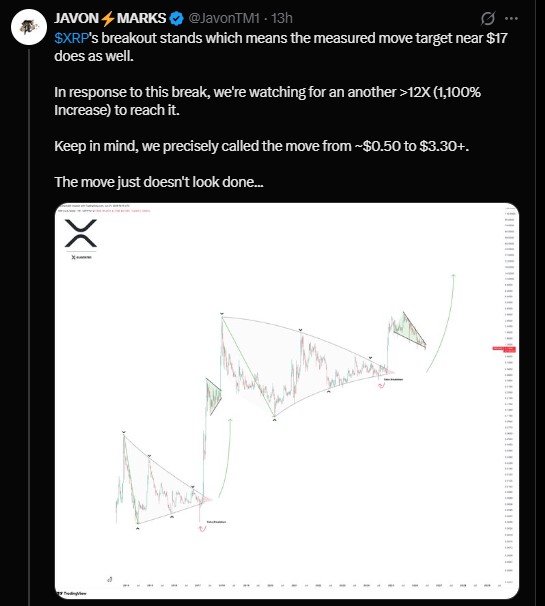
Since then, Ripple has been consolidating in a smaller triangle pattern. Analyst Javon Marks says this breakout still stands.
From a broader technical analysis perspective, the market is now watching whether XRP can reclaim and hold previous resistance levels with stronger volume. A sustained breakout would strengthen the bullish thesis, while a rejection could send the price back toward lower support zones.
Readers tracking the broader XRP price prediction 2026 outlook can also compare this long-term structure with the latest technical and fundamental forecasts.
Why Is Javon Marks Watching a $17 $XRP Target?
Javon Marks, a widely followed crypto analyst, said the measured move target near $17 remains valid as long as the current breakout holds.
He pointed out that his team correctly called the move from around $0.50 to $3.30 earlier.
Based on the same methodology, a move greater than 12X from current levels would be needed to reach $17.
That would represent roughly a 1,100% increase from the $1.15 area where it was trading at the time of writing.
The important point is attribution. The $17 target discussed here comes from Javon Marks' measured-move analysis. It should not be confused with the $10 target discussed by CryptoPatel or the $7-$10 cycle view associated with EGRAG Crypto.
These are separate projections based on different assumptions.
What Is the CryptoPatel $XRP Analysis Saying?
A separate monthly chart from CryptoPatel shows a different but compatible view.
The chart labels the $0.50 to $1.00 band as an accumulation zone. From that base, a breakout already occurred and pushed toward $3.24.
The projection in that chart maps a possible correction back toward $0.85 to $1.00, followed by a second and much larger leg up targeting $9.20 by 2027 or 2028.
That $9.20 level represents roughly a 1,245% move from the base, and the chart labels $10.00 as the long-term target zone.
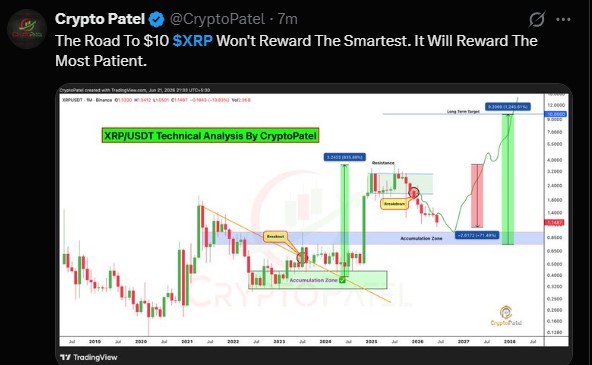
Therefore, the Ripple $10 $XRP target discussed in this analysis is primarily associated with CryptoPatel's long-term chart projection, while the $17 target is attributed to Javon Marks' measured-move thesis.
For readers interested in a longer-term XRP price prediction 2027, the $9.20-$10 range represents a multi-year scenario rather than an immediate price target.
What Is the EGRAG Crypto View on $XRP Patience?
EGRAG Crypto, another respected voice in the community, framed the situation differently.
The road to $10 will not reward the smartest traders. It will reward the most patient ones.
That view aligns with the long-term chart data. Every major move took time, and each breakout followed a long period of quiet consolidation.
EGRAG Crypto's broader cycle view has been discussed in the $7-$10 range, placing it between the more conservative institutional targets and the more aggressive $17 projection from Javon Marks.
This difference highlights why price targets should be viewed as scenarios rather than guarantees.
What Do $XRP Derivatives Numbers Show?
The derivatives data tells a clear story right now.
As per CoinGlass data, the 24-hour long/short ratio on Binance stands at 2.639 for regular accounts. Top trader accounts show a ratio of 2.9793 for long/short by accounts and 1.7456 by position size.
This means more traders are positioned for upside than downside across major platforms, including OKX, where the long/short ratio is 2.48.
The 24-hour liquidation data shows $2.29 million in longs were wiped versus $533,970 in shorts, meaning longs have actually faced more liquidation pressure during the period despite the overall bullish positioning.
Open interest sits at $2.60 billion, down slightly by 1.05%. Volume is up 36.33% to $1.93 billion over 24 hours, showing elevated activity.

For traders following trading volume, the combination of rising volume and slightly declining open interest may suggest that market activity is increasing without a major expansion in outstanding positions.
This is an important part of the current $XRP analysis today, as a sustained price breakout would ideally be supported by stronger spot demand rather than derivatives activity alone.
Is the US Senate CLARITY Act a Factor for Ripple?
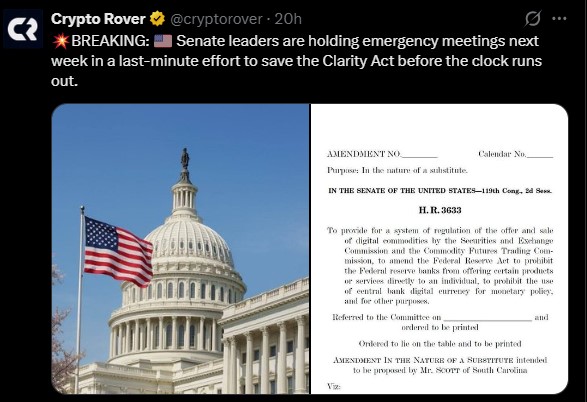
Senate leaders are holding emergency meetings to push the CLARITY Act forward before the current legislative window closes.
If passed, the CLARITY Act would give crypto assets a clearer regulatory status in the United States.
XRP, which has been at the center of a multi-year SEC lawsuit, could benefit significantly from such clarity.
Regulatory certainty has historically acted as a catalyst for price moves. Traders are watching this development closely.
The regulatory outcome could also influence the longer-term XRP forecast, especially if clearer rules encourage institutional participation and additional financial products.
Are $XRP ETF Flows Driving the Price Target?
ETF flows have become one of the biggest narratives in the market.
The latest available figures show U.S. spot XRP ETFs holding approximately $988 million in assets as of July 2. Bitwise recorded $6.55 million in inflows on that day.
Total net inflows across $XRP ETF issuers have climbed to roughly $1.487 billion, while June alone added around $59.46 million.
The weekly ETF net-flow picture is therefore an important metric to monitor alongside price action. Continued positive inflows could strengthen the demand narrative behind higher XRP price targets, while weaker or negative flows could reduce momentum.
This is why the $XRP price prediction this week cannot be based on chart patterns alone. ETF flows, derivatives positioning, regulatory developments, and broader crypto liquidity are all important factors.
What Model Could Support a $10 or $17 $XRP Target?
The long-term targets discussed above come primarily from chart-based measured moves and cycle projections. A transparent $XRP price model should also consider multiple technical indicators.
The model used for this analysis considers:
-
RSI: Measures momentum and helps identify overbought or oversold conditions.
-
EMA structure: The 20, 50, 100, and 200 EMAs help determine the broader trend and potential resistance.
-
MVRV: Provides a valuation and market-cycle sentiment cross-check.
-
Trading volume: Helps determine whether a breakout has meaningful participation.
-
ETF flows: Tracks institutional demand and potential long-term buying pressure.
-
Fibonacci levels: Used as secondary support and resistance references after confirmed swing highs and lows.
These indicators do not directly produce a guaranteed $10 or $17 price target. Instead, they help assess whether the market conditions are strong enough to support the assumptions behind those long-term projections.
The $10-$17 targets require a significant expansion in market capitalization, sustained demand, and a favorable broader crypto cycle.
For a detailed look at XRP support and resistance levels, traders should continue monitoring the key zones that could confirm or invalidate the current bullish structure.
$XRP Price Prediction: Bull, Base and Bear Scenarios
The following scenario model combines technical structure, RSI, EMA trends, MVRV, volume, ETF flows, and regulatory catalysts.
| Scenario | Price Target | Probability | Invalidation Level |
| Bull Case | $9.20-$17.00 | 20% | Sustained breakdown below $0.85 |
| Base Case | $2.80-$7.00 | 50% | Breakdown below $1.00 |
| Bear Case | $0.85-$2.40 | 30% | Sustained breakout above $3.24 |
The base case currently carries the highest probability because it has already demonstrated strong historical recovery patterns but still faces uncertainty around the timing of the next major cycle expansion.
The bull case requires $XRP to break above the $3.24 area and sustain strong volume, XRP ETF inflows, and broader crypto market liquidity.
The bear case remains possible if XRP fails to maintain the current structure and returns toward the $0.85-$1.00 accumulation zone.
These probabilities are analytical estimates and should not be considered financial advice or guaranteed forecasts.
Could $XRP Still Drop Before Moving Higher?
Yes, and that is part of the scenario some analysts are tracking.
The CryptoPatel chart shows a potential pullback to the $0.85 range before the next major move begins. That drop would represent around 71% from the 2024 peak.
Nothing in crypto moves in a straight line. A return to the accumulation zone does not cancel the larger bullish thesis for many analysts.
From an XRP bullish or bearish perspective, a correction toward support could actually reset momentum if long-term demand remains strong. However, a deeper breakdown accompanied by falling ETF inflows and weak trading volume could invalidate the bullish structure.
This is also why the answer to will XRP go up tomorrow remains uncertain. Short-term price movements can be heavily influenced by derivatives liquidations and market sentiment, while $10-$17 targets depend on much longer-term conditions.
XRP Price Target: Comparing Major Analyst Views
The major XRP targets discussed in the market are not identical and should be attributed carefully.
| Analyst/Source | XRP Price Target | Time Horizon/Context |
| Standard Chartered | Around $2.80 | 2026 base-case outlook |
| EGRAG Crypto | $7-$10 | Long-term cycle view |
| CryptoPatel | $9.20-$10.00 | 2027-2028 projection |
| Javon Marks | Around $17 | Measured-move breakout target |
This comparison shows the wide range of possible XRP price targets.
Standard Chartered's roughly $2.80 projection is considerably more conservative than the long-term technical projections from CryptoPatel and EGRAG Crypto.
Meanwhile, Javon Marks' $17 target represents the most aggressive projection among these four views.
Investors should therefore distinguish between institutional forecasts, technical measured moves, and long-term cycle projections.
Summary of Key XRP Price Levels to Watch
-
Support zone: $0.85 to $1.00
-
Current resistance area: $2.40 to $3.24
-
Mid-term target: $9.20 (CryptoPatel)
-
Long-term target: $10.00 (CryptoPatel long-term resistance)
-
Extended target: $17.00 (Javon Marks measured move)
The Ripple $10 XRP target remains a long-term scenario rather than a guaranteed outcome. CryptoPatel's chart points toward $9.20-$10, while EGRAG Crypto's cycle view reaches $7-$10 and Javon Marks' measured-move analysis extends toward $17.
The key question for investors is whether the current breakout can develop into a sustained long-term trend. ETF inflows, regulatory clarity, trading volume, and the broader crypto cycle could all determine how close it eventually comes to these ambitious targets.
Disclaimer
This article is for informational purposes only and does not constitute financial advice. Cryptocurrency investments carry significant risk, including the potential loss of all capital. Analyst price targets are speculative and may not be achieved. Always conduct your own research and consult a licensed financial advisor before making any investment decisions.