XRP Price Prediction: XRP $1.17 Resistance Rejection Again


XRP is changing hands near $1.1377 today, up a small 0.07% over the past day.
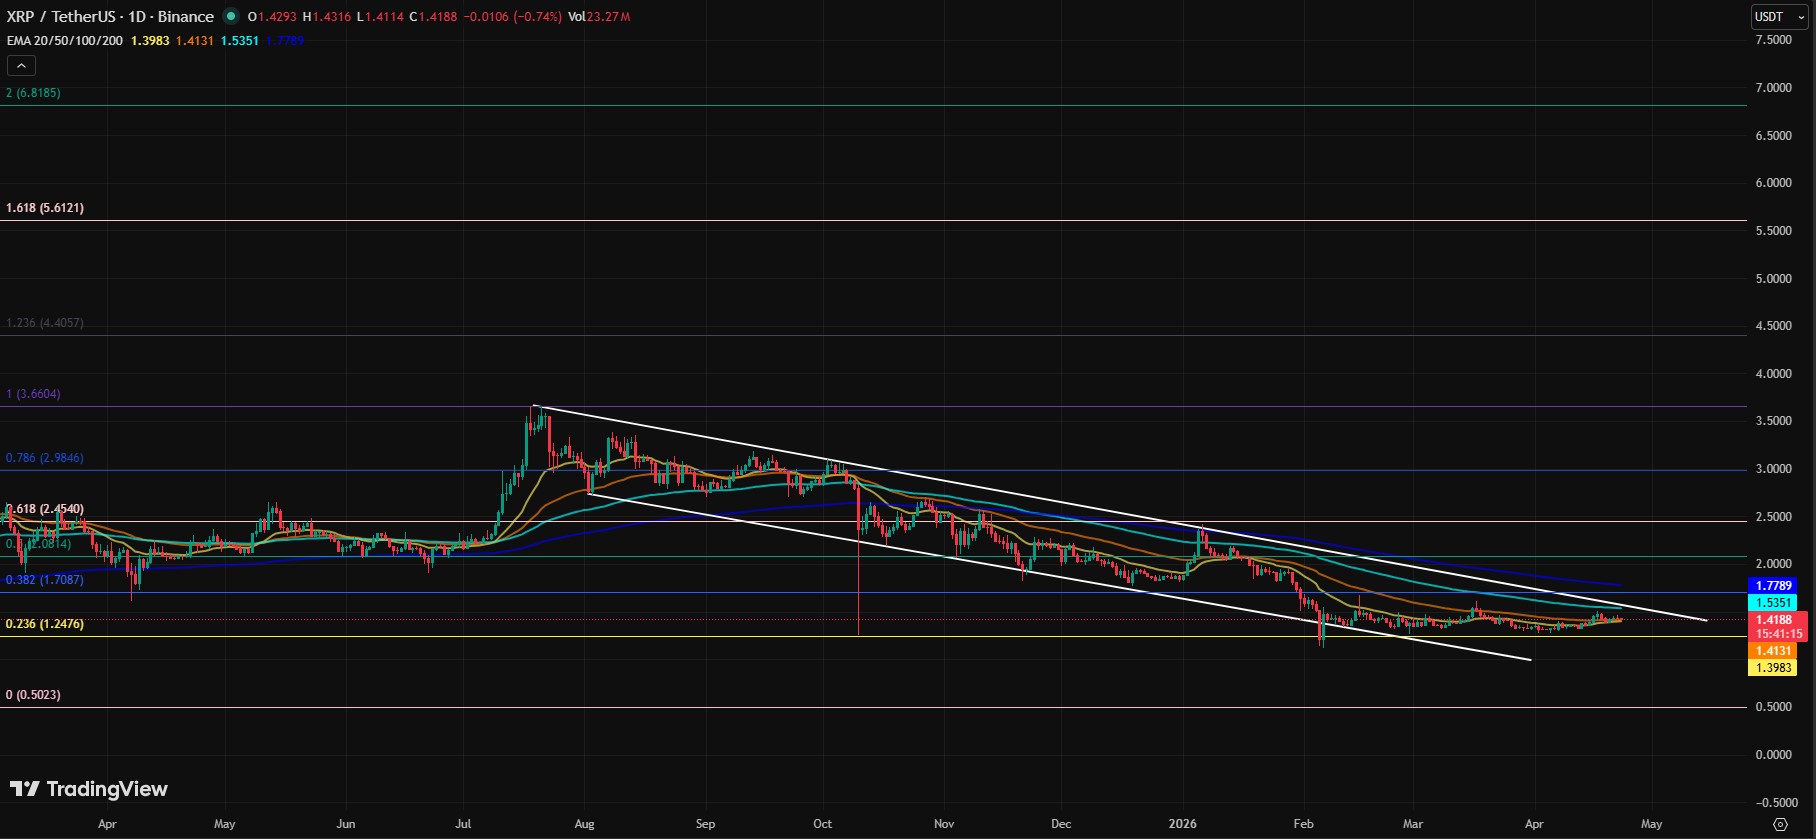
Earlier, the coin pushed up to $1.161 before sellers stepped back in. This level sits right at the top of a long-running downward trendline that has capped the altcoin for months. This latest XRP $1.17 resistance rejection has once again raised questions about whether bulls can finally break the trendline.
Anyone watching an XRP price prediction today will notice bulls keep getting turned away at the same spot. The short-term outlook remains mixed, leaning cautious, as declining futures volume, heavy long positioning on major exchanges, and fresh long liquidations suggest momentum is cooling.
However, ETF demand and potential regulatory clarity remain important catalysts for the broader $XRP forecast.
Is $XRP Going Up or Down Today?
The short answer is mixed, leaning cautious.
Futures volume dropped nearly 30% in the last 24 hours, falling to $1.75 billion. That's a sign momentum is cooling off after the failed breakout attempt.
Spot volume is much smaller at $266.54 million. Futures traders are still driving most of the action here, not everyday spot buyers.
Open interest sits at $2.41 billion, down just under 1%. Traders aren't rushing to add new bets in either direction.
The $1.17 area is therefore becoming an important decision zone. The rejection suggests sellers remain active near resistance, while the relatively balanced overall long/short ratio shows the market has not fully committed to a bearish direction.
Are $XRP Traders Long or Short Right Now?
This is where things get interesting.
As per CoinGlass data, the overall 24-hour long/short ratio is 0.979, basically split down the middle.
But zoom into individual exchanges, and the picture flips:
| Exchange/Metric | Long/Short Ratio |
| Binance (accounts) | 2.8447 |
| OKX (accounts) | 2.55 |
| Binance Top Trader (accounts) | 3.2882 |
| Binance Top Trader (positions) | 1.4694 |
Big traders and everyday accounts on Binance and OKX are leaning heavily long. That gap between the overall market and these exchanges suggests other corners of the market are shorting into the rally.
This creates a potential squeeze setup. If it breaks above the $1.16-$1.18 zone, short positions could add fuel to the move. However, if the price loses $1.137 support, heavily positioned longs could face another wave of liquidations.
How Much Ripple Was Liquidated Today?
A fair amount, especially on the long side.
| Timeframe | Total Liquidated | Longs | Shorts |
| 1 hour | $318.74K | $318.73K | $8.54K |
| 4 hours | $631.26K | $631.03K | $238.32 |
| 12 hours | $2.22M | $909.27K | $1.31M |
| 24 hours | $3.06M | $1.61M | $1.45M |
The 1-hour and 4-hour numbers show longs getting wiped out almost entirely. That matches the sharp drop after price touched $1.161.
For traders tracking XRP trading volume, the combination of falling futures volume, declining open interest, and long liquidations suggests the recent bounce has not yet attracted enough fresh conviction to confirm a sustainable breakout.
Why Is $XRP Price Moving Today?
A few things stand out.
U.S. spot $XRP ETFs now hold $988 million in assets as of July 2. Bitwise brought in $6.55 million in inflows that same day.
Total net inflows across all ETF issuers have climbed to roughly $1.487 billion. June alone added $59.46 million.
ETF flows remain one of the biggest narratives behind the current $XRP price action. Sustained ETF inflows could provide an important demand floor, while slowing flows could weaken the bullish case.
The latest available ETF data also shows why institutional demand has become a major part of the $XRP price target discussion. Traders are increasingly watching whether ETF inflows can continue supporting $XRP even when technical momentum remains weak.
On the regulatory side, the CLARITY Act missed its self-imposed July 4 deadline. If the Senate doesn't act soon, the next real shot comes in the fall session.
This matters more for XRP than most coins. Its March 2026 status as a digital commodity is currently just an agency interpretation, not law. The CLARITY Act would lock that classification in permanently.
$XRP $1.17 Resistance Rejection: Technical Analysis Today
The XRP $1.17 resistance rejection remains the clearest technical signal today.
Resistance sits at $1.16 to $1.18, the same descending trendline that's held for months.
Support is closer, around $1.137 to $1.140.
The order-book and liquidity picture also matters around this zone. Repeated rejection near $1.16-$1.18 indicates that sell-side liquidity remains concentrated around the trendline. A sustained move above this area, preferably with rising spot volume, would provide stronger confirmation than a brief intraday wick.
Every major EMA is sitting above the current price. The 20 EMA is at $1.118, the 50 EMA at $1.184, the 100 EMA at $1.286, and the 200 EMA at $1.496.
That lineup still points to a bearish longer-term trend.
The RSI reads 51.37, above its average of 39.66. Momentum has cooled from oversold levels but hasn't turned strongly bullish either.
The moving averages therefore remain a key hurdle for bulls. The 50 EMA near $1.184 is particularly important because it sits close to the current $1.16-$1.18 resistance zone.
The current XRP analysis today uses four primary technical inputs: RSI for momentum, the 20/50/100/200 EMAs for trend direction, trading volume and open interest for market participation, and MVRV as a valuation and sentiment cross-check.
$XRP Fibonacci levels can also be used as a secondary reference after a confirmed swing high or low, while whale accumulation would provide additional confirmation if large holders begin increasing exposure. However, the current $1.16-$1.18 trendline remains the more immediate resistance.
For a broader outlook, readers can also check the XRP price prediction 2026 analysis and the latest XRP support and resistance levels.
XRP Price Prediction: Bull, Base and Bear Scenarios
The following XRP price scenarios are based primarily on RSI, EMA structure, trading volume, open interest, ETF flows, and the potential impact of regulatory developments. MVRV is used as a secondary valuation and sentiment indicator. These are scenario estimates, not guaranteed targets.
| Scenario | Target | Probability | Invalidation Level |
| Bull Case | $1.80-$2.20 | 25% | Daily close below $1.09 |
| Base Case | $1.15-$1.50 | 50% | Break below $1.05 |
| Bear Case | $0.90-$1.05 | 25% | Reclaim above $1.18 |
The base case currently carries the highest probability because it remains below major moving averages and has failed repeatedly near the descending trendline.
A decisive breakout above $1.18, supported by stronger spot volume and continued ETF inflows, could shift the model toward the bull case.
On the other hand, a breakdown below $1.137 could increase liquidation pressure and push it toward the $1.09-$1.05 area.
$XRP Price Target: What Are Analysts Predicting?
Analyst forecasts remain widely separated, highlighting the uncertainty around any long-term XRP price prediction.
Standard Chartered's Geoffrey Kendrick has a reported 2026 target of around $2.80 after reducing an earlier $8 forecast.
EGRAG Crypto has presented a much more aggressive cycle view in the $7-$10 range.
Other bullish market forecasts also extend toward the $5-$10 area, although these are speculative and depend heavily on strong ETF demand, broader crypto liquidity, and regulatory clarity.
These targets should not be treated as guarantees. The wide gap between institutional forecasts and cycle-based projections shows why investors should separate short-term technical levels from long-term price targets.
The current technical setup is focused on the $1.137 support and $1.16-$1.18 resistance range, while the longer-term analyst targets depend on factors that could take months or years to develop.
Will $XRP Go Up or Down Next?
If the altcoin loses the $1.137 support, the heavy long positioning on Binance and OKX could face more liquidations.
A break below the $1.09-$1.05 area would weaken the current structure further.
A move back above $1.16 to $1.18 would need to absorb that same bearish pressure to hold. If bulls reclaim the trendline with strong spot volume and improving ETF flows, the next XRP price target could shift higher.
Whether that happens may depend as much on the CLARITY Act's progress and ETF demand as on the charts themselves.
For anyone asking will XRP go up tomorrow, the answer depends heavily on whether $1.137 support holds and whether bulls can reclaim $1.16-$1.18.
For the price prediction this week, the key battle remains between support near $1.137 and resistance around $1.16-$1.18.
The current setup is therefore XRP bullish or bearish? In the short term, the market is mixed. In the broader trend, XRP remains cautious to bearish until it can reclaim the major moving averages and break the descending trendline.
Disclaimer: This article is for informational purposes only and does not constitute financial, investment, or trading advice. Cryptocurrency markets are highly volatile and carry significant risk. Always do your own research and consult a licensed financial advisor before making any investment decisions.








.webp)








