Silver Price Prediction: Why Is XAGUSD Down Today? What's Next?


A breakout that looked convincing just days ago is now behaving in a way that has traders rethinking their next move, and this silver price prediction digs into exactly what changed on the chart.
Before getting into the details, this is a purely chart- and data-based reading, not a personal position or financial advice.
Silver Price Today: Live Data
Silver (XAGUSD) is priced at $65.08, down 1.52% over the past 24 hours. Market cap for the metal stands at $260.32B with a fully diluted value of $3.64T.
Total supply sits at 56B XAG, with a self-reported circulating supply of 4B XAG, and no fixed maximum supply applies to this asset the way it would for a crypto token.
Source: CoinGlass, September 22, 2026
Silver News Today
The silver news today comes from Elliott Wave Forecast, which noted that XAGUSD is pulling back toward what it called a long-term buying opportunity, with the 1-hour structure showing the area just before a possible turn. 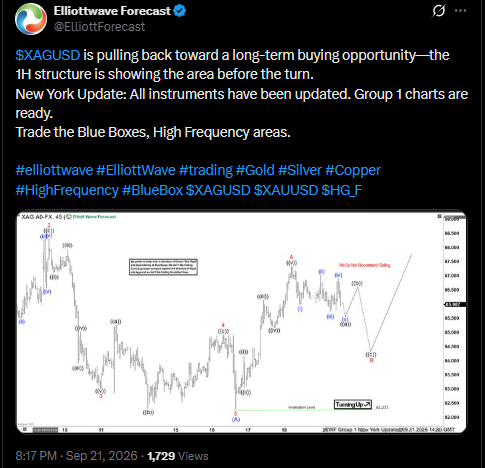
The post mentioned that all instruments across the desk had been updated, with fresh charts ready for gold, silver, copper, and other metals under their ongoing wave count coverage.
While this kind of Elliott Wave commentary leans more technical than fundamental, it lines up with the idea that the current pullback in silver could still be part of a larger uptrend rather than a full reversal, though that view will only be confirmed or denied by how price behaves at the support levels ahead.
Source: Elliott Wave Forecast on X, September 21, 2026
Quick Take
CMP: $64.897 on the 1-hour OANDA chart
Bullish trigger: close above 68.32064
Bearish trigger: close below 64.01740
Data timestamp: September 22, 2026
Risk note: the breakout above the descending trendline has not yet produced a higher high, which is the main warning sign in this setup right now
Silver Price Prediction 2026 Technical Analysis
On the 1-hour XAGUSD chart on OANDA, silver spent weeks grinding lower inside a long descending trendline that stretched all the way back to late August. 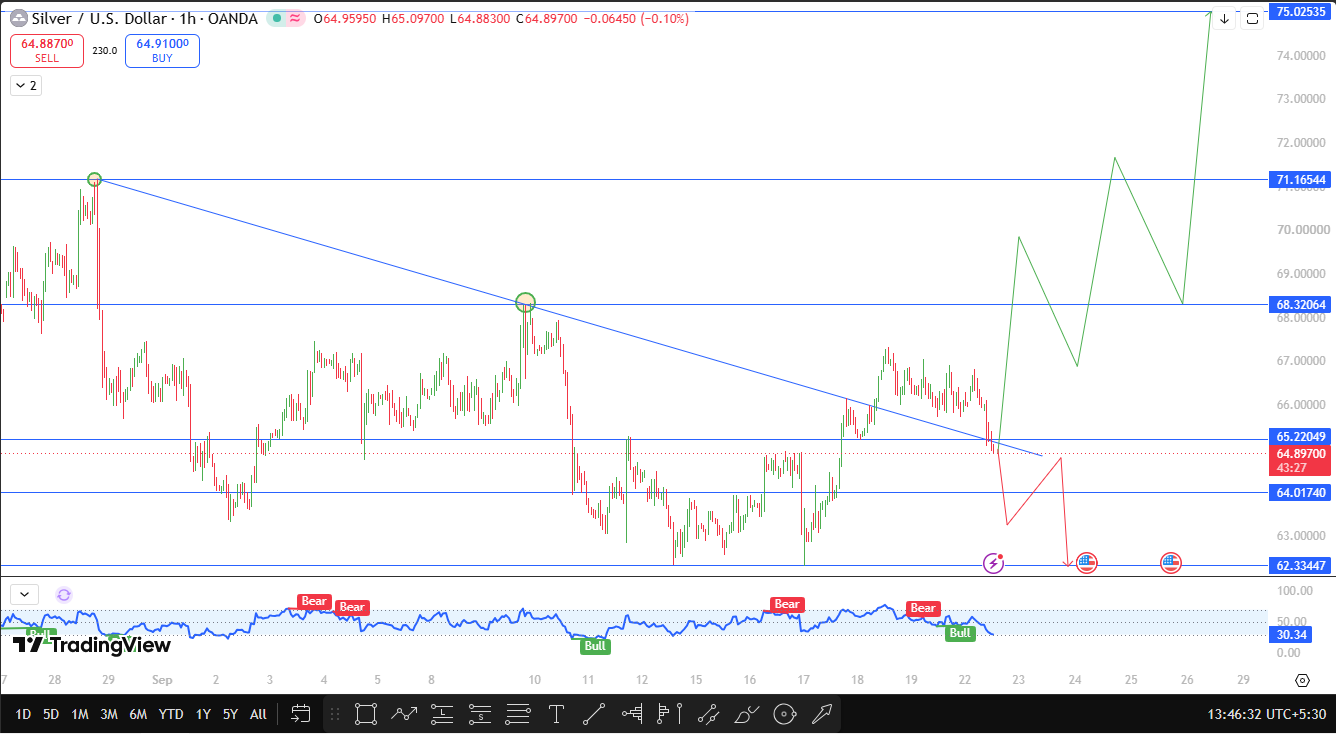
That trendline finally gave way with a breakout, which is normally read as an early bullish signal.
The problem is that instead of building on that breakout with a fresh higher high, the price has actually turned around and printed a lower low, which is not the kind of follow-through a genuine trend reversal usually shows early on.
The oscillator at the bottom of the chart has swung between Bull and Bear labeled zones several times over the past few weeks and is currently sitting at 30.34, closer to the lower end of its recent range.
The two prior times this oscillator dropped into a similar zone, it was tagged with a Bull label, and the price found a bounce shortly after, so this current reading puts silver in a similar spot to watch closely.
If XAGUSD closes below 64.01740, that would confirm the recent lower low as a genuine breakdown rather than just noise, and the next support to watch would be 62.33447.
On the other hand, if price manages to reclaim ground and close above 68.32064, that would put the breakout narrative back on track, opening the path toward 71.16544 and then the bigger 75.02535 level further out.
Support and Resistance Levels
Level Type | Price | Distance from CMP ($64.897) |
Resistance 3 | 75.02535 | 15.61% above |
Resistance 2 | 71.16544 | 9.66% above |
Resistance 1 | 68.32064 | 5.28% above |
Current Price | 64.897 | - |
Support 1 | 64.01740 | 1.35% below |
Support 2 | 62.33447 | 3.95% below |
Bull, Base, and Bear Case
In the bullish scenario, the lower low seen recently turns out to be a shakeout rather than a genuine breakdown; the oscillator's low reading marks another turning point the way it has twice before, and silver climbs back to close above 68.32064, opening the door to 71.16544 and eventually 75.02535 if momentum keeps building.
In the base case, silver spends more time chopping between 64.01740 and 68.32064 while the market waits to see whether the trendline breakout was real or a false start.
Given how close the price is currently sitting to the lower boundary of that range, this zone could see some volatility either way.
In the bearish scenario, the lower low is confirmed with a close below 64.01740, the earlier breakout above the descending trendline turns out to have been a fake move, and silver heads toward 62.33447 as the next real support in that case.
Risks to Watch
Silver's price action is often influenced by broader macro factors like real yields, dollar strength, and industrial demand alongside its usual safe haven role, so moves here can happen independently of the pure chart structure.
The fact that a recent breakout has already failed to produce a higher high adds extra uncertainty to any bullish read at this stage.
Traders should also watch how gold behaves over the same period, since silver frequently takes cues from moves in the broader precious metals complex.
Silver Price Forecast 2030 Long-Term Outlook
Looking out toward 2030, silver's case rests less on any single chart pattern and more on a supply and demand story that has been building for years.
Industrial demand from solar panel production and electronics continues to eat into available above-ground stockpiles, while mine supply growth has stayed fairly limited across the industry.
If that gap between industrial consumption and new supply keeps widening the way it has recently, silver has a reasonable structural case for trading meaningfully higher by the end of the decade, even though the exact path to get there will likely include plenty of pullbacks like the one playing out right now.
Glossary
Descending Trendline: A line drawn along a series of falling highs, used to track an ongoing downward trend
Lower Low: A price low that sits below the previous low, often read as a sign of continuing weakness
Fully Diluted Value (FDV): The theoretical total value of an asset if its entire maximum or total supply were in circulation at current price
Support and Resistance: Price zones where an asset has historically struggled to break through or hold below
Disclaimer
This article is for informational purposes only and should not be treated as financial or investment advice. Commodity and currency markets are volatile, and readers should conduct their own research before making any trading decisions.
















