TREAD Price Prediction: Can the Trend Hold This Week?


A fresh TREAD price prediction matters right now because the token just moved fast. TREAD trades near $0.8447, up more than 55% across 24 hours. Anyone tracking the broader crypto news cycle this week has probably seen the ticker pop up somewhere.
The move didn't come from nowhere. A supply burn, a new futures listing, and a sharp volume spike all landed in the same stretch. Momentum is real, but so is the risk of a pullback.
This snapshot is dated September 25, 2026, at 09:19 UTC, pulled from live trading data. The next seven days will test whether buyers can hold the line or whether this was a short, sharp squeeze.
TREAD Quick Prediction Box
Metric | Data |
Current Price | $0.8447 |
24H Change | +55.8% |
7-Day Range | $0.65 – $1.05 (scenario) |
Trend | Bullish |
Next Target | $0.9589 |
Support | $0.8279 |
Resistance | $0.8955 |
RSI | 85.22 (overbought) |
MACD | Bullish, 0.0712 above signal 0.0483 |
Bull Case | $1.28 |
Base Case | $0.96 |
Bear Case | $0.65 |
Invalidation | Below $0.56 |
TREAD Price Today and Current Market Setup
TREAD is trading at $0.8447 as of the snapshot above. The 24-hour range runs from $0.5602 to $0.8955, and that's a wide band for one day.
Market cap sits near $88.42M, fully diluted at the same figure since supply is capped. Trading volume over 24 hours reached roughly $3.20M, a jump some aggregators put above 100% growth day over day.
Turns out, the all-time high of $0.8955 was set just below where the price trades now. That's close. Very close.
TREAD Recent Price Action
Price climbed from an hourly open near $0.8437 up to $0.8616, then aggregators showed an even sharper print near $0.89 on some venues. The candles show a clean stair-step higher with few deep pullbacks.
Momentum looks like it's expanding, not fading. But traders chasing a move this far into overbought territory should know the risk. Reversals happen fast here.
TREAD Trading Volume and Market Activity
Volume backs the move. The chart's volume SMA sits at 782, and recent bars pushed well above that baseline during the rally.
Rising price on rising volume is usually a healthier signal than a quiet grind higher. Here's the thing: thin liquidity can still make swings sharper than they look on paper.
Fresh new exchange listings tend to pull volume higher too, and that pattern shows up here.
$TREAD Technical Analysis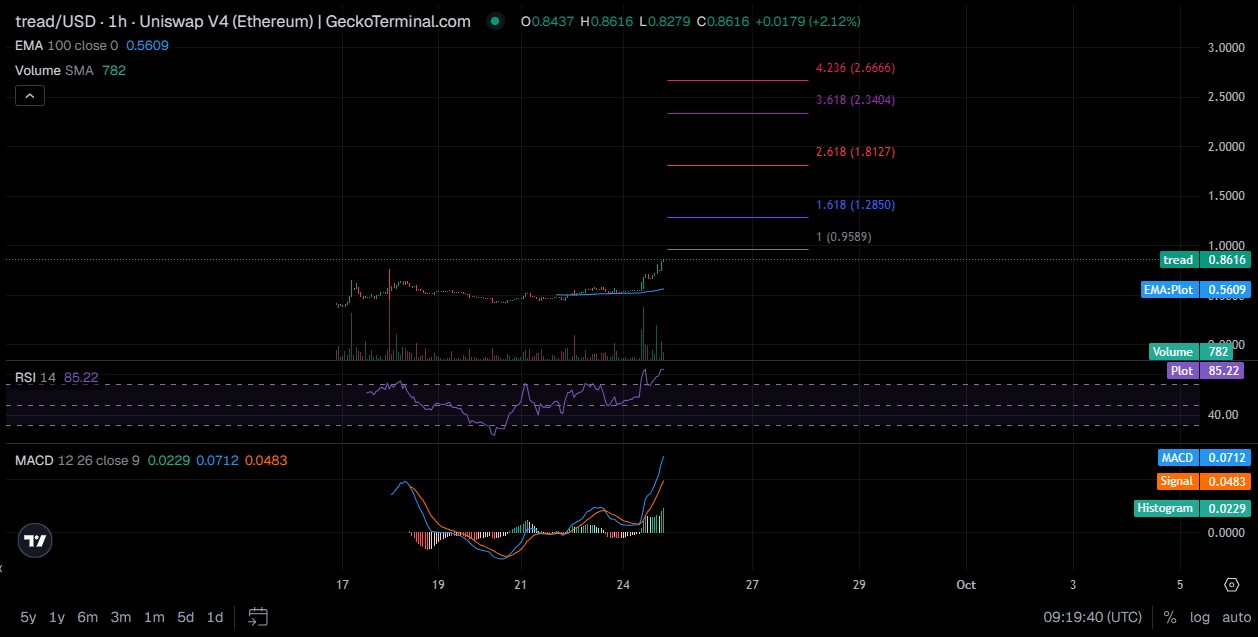
Numbers carry more weight than opinions here. Traders following AI and crypto news often expect automated signals to line up before confirming a trade, and RSI, MACD, and volume are the three worth checking together.
RSI Signal
RSI (14) reads 85.22. That's deep overbought territory, well above the standard 70 threshold. Momentum favors buyers, but stretched readings like this often precede a cooldown, not a collapse.
MACD Signal
MACD trades at 0.0712, sitting above the signal line at 0.0483. The histogram, at 0.0229, confirms a bullish gap between the two lines. No bearish crossover has shown up yet.
Volume Confirmation
Volume expansion supports the rally so far. When trading activity rises alongside price, continuation odds improve. A drop in volume during the next push higher would be a warning sign worth watching.
TREAD 7-Day Price Prediction
A seven-day $TREAD price prediction has to account for how stretched the current rally already looks. RSI north of 80 rarely holds for long without some cooling off.
Traders sizing this call often weigh it against fresh presale and IDO listings, since new launches can pull short-term liquidity away from established tokens.
Base case points toward consolidation near the $0.90 to $0.96 zone before any fresh leg higher. And that assumes broader market conditions stay calm.
Base-Case 7-Day Outlook
Price grinds between $0.75 and $0.96, testing resistance a few times before deciding direction. Trading volume likely eases from the current spike but stays above average.
Bullish Scenario
A clean break and sustained trading above $0.96 opens the door toward the $1.28 fibonacci extension. Fresh catalysts, more exchange listings, or continued burns could fuel that move.
Bearish Scenario
Losing the $0.83 intraday support could send $TREAD retesting $0.65, and a deeper slide risks a return toward the $0.56 EMA zone. That would undo most of this week's gains.
TREAD Support and Resistance Levels
Levels matter more than headlines right now. Traders watching $TREAD support and resistance need a short list, not a wall of numbers.
Key Support Levels
Near-term support sits at $0.8279, the recent session low. Below that, the $0.5609 EMA (100-period) marks the major trend line most traders will defend.
Key Resistance Levels
Immediate resistance holds at $0.8955, the current 24-hour and all-time high. Above that, the fibonacci 1.0 extension near $0.9589 becomes the next real test.
What Could Move TREAD Over the Next 7 Days?
Bullish Catalysts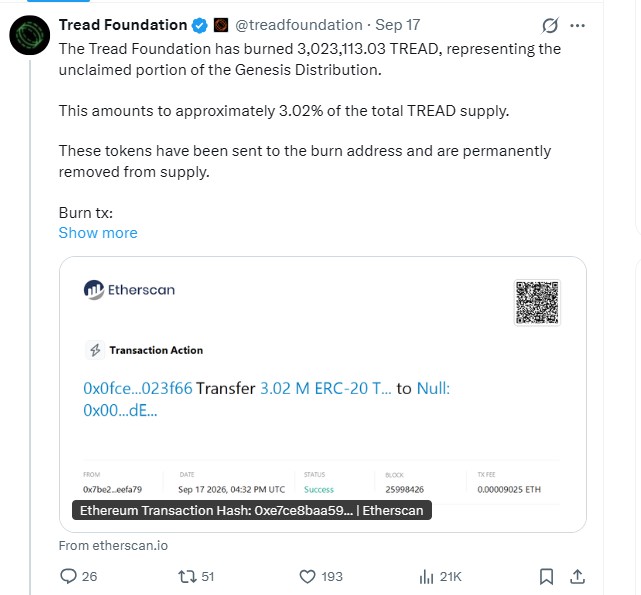
The Tread Foundation burned over three million tokens, cutting circulating supply by roughly 3%, according to its own announcement on X. Scarcity narratives tend to draw fresh attention, at least for a while.
Bearish Risks
Overbought conditions plus thin holder counts (185 holders per on-chain data) leave room for sharp swings either way. A handful of large wallets exiting could move the price fast.
Some of that liquidity may already be chasing fresh crypto airdrop opportunities elsewhere, thinning out TREAD's order book further.
Bitcoin and Broader Crypto Market Impact
Small-cap tokens rarely move in isolation. A risk-off swing in Bitcoin usually drags altcoins like $TREAD lower regardless of local strength. And a Bitcoin rally can pull TREAD along for the ride, amplifying whatever trend is already in motion.
Checking a wider crypto events calendar helps too, since macro releases and token unlocks elsewhere often move Bitcoin first.
TREAD Breakout and Breakdown Levels
What Would Confirm a Breakout?
Sustained trading above $0.96 on strong volume, not just a brief wick, would confirm a breakout toward the next fibonacci band near $1.28.
What Would Signal a Breakdown?
A close below $0.83 followed by failure to reclaim it within a session or two would signal a breakdown, opening a path back toward $0.65.
TREAD Price Prediction Invalidation Level
Here's the part most coverage skips. The entire bullish setup for this $TREAD price prediction invalidates below $0.56, the 100-period EMA on the hourly chart.
That line represents the broader trend, not just a short-term bounce. Trading below it for more than a session or two would mean the rally structure is broken. Fine. That's the line in the sand.
TREAD 7-Day Forecast: Trader Takeaway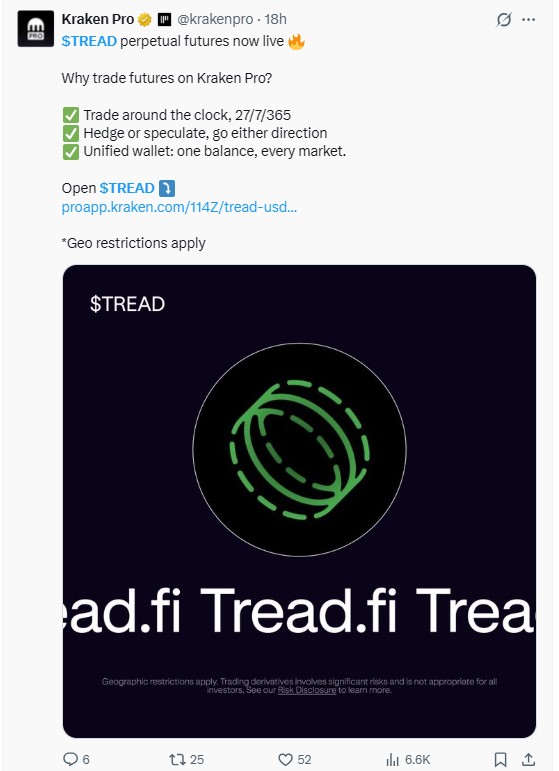
Key support: $0.8279, then $0.5609.
Key resistance: $0.8955, then $0.9589.
Trigger level: sustained trading above $0.96.
Invalidation: a break below $0.56.
Main catalyst: the token burn and the new Kraken Pro futures listing. Main risk: an overbought RSI cooling off hard.
When the RSI print first came up during this review, the number that stood out was 85. That's not a subtle overbought reading. It's a loud one.
But volume hasn't rolled over yet, and MACD still leans bullish. The trend holds until it doesn't.
Traders comparing this setup against other price prediction coverage should weigh the overbought risk against the fresh catalysts before sizing any position.
Disclaimer
This article is for informational purposes only and does not constitute financial, investment, or trading advice. Cryptocurrency markets are highly volatile, and prices such as those for $TREAD can change rapidly. Readers should conduct independent research and consult a licensed financial advisor before making any investment decisions. Past performance and technical patterns do not guarantee future results.

















