Polkadot Price Prediction: Can $DOT Really 10X From Here?


Polkadot is drawing attention as $DOT traders watch the chart after a sharp pullback cut into recent gains. The price is trading at $1.1665, which has been climbing inside a tight rising channel before sellers stepped in on the latest candles.
This Polkadot Price Prediction breaks down where $DOT stands and which support and resistance zones matter most next.
Polkadot is a blockchain network built to connect multiple specialized chains into one shared ecosystem, according to the project's own materials. Stick around for what's next.
Chart data checked on September 22, 2026.
Polkadot Technical Analysis
DOT spent the past several sessions grinding higher inside a well-defined rising channel, with each pullback along the way finding buyers before the price pushed to a new local high.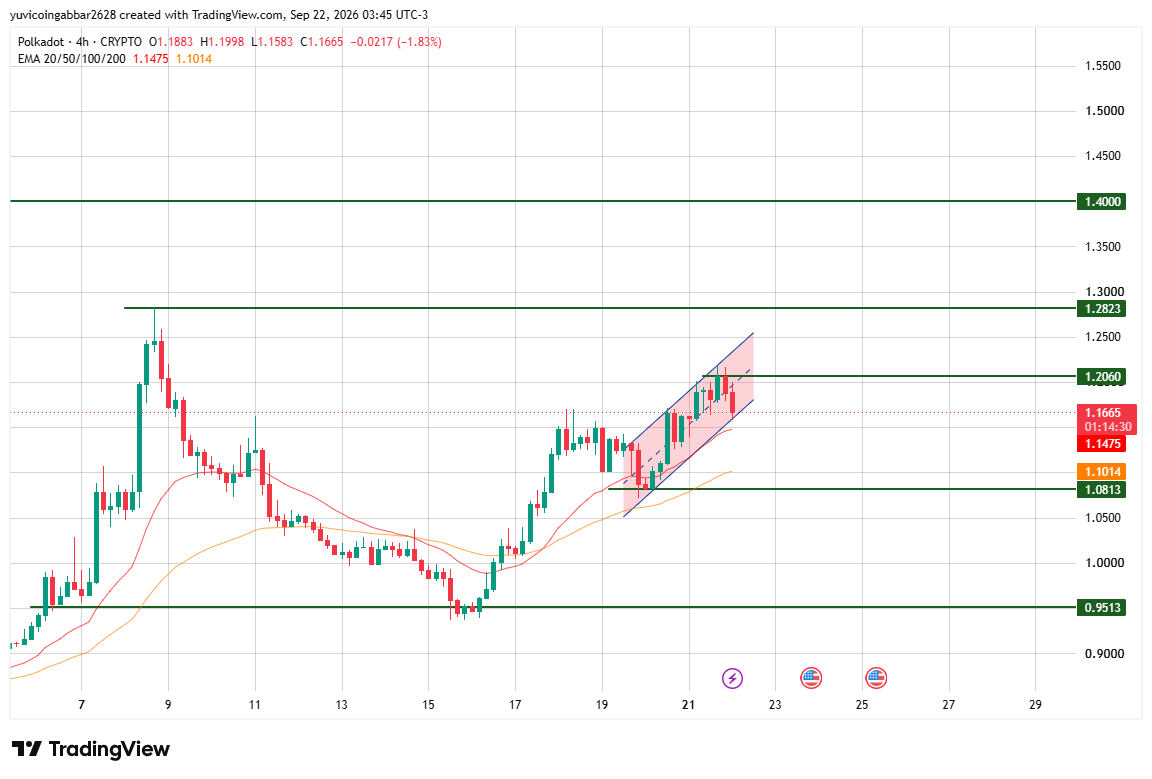
This pullback has brought DOT right into the EMA cluster sitting just beneath the current price, with the shorter 20 EMA at $1.1475 and the longer 50 EMA at $1.1014 forming a layered support zone rather than a single line.
How price behaves around this cluster over the next few candles matters more than the pullback itself: a bounce here would suggest the channel uptrend is simply digesting its recent gains.
While a clean break below Channel would be the first real sign that the rally is losing steam and that deeper support levels need to be tested.
DOT Outlook: Support and Resistance Levels
Level Type | Price |
Resistance 3 | $1.4000 |
Resistance 2 | $1.2823 |
Resistance 1 (nearest) | $1.2060 |
Immediate Price Reference | $1.1665 |
Deeper Support | $1.0813 |
Structural Floor | $0.9513 |
Polkadot Forecast: Bull Case vs Bear Case
Bull case: Holding above the EMA cluster near $1.1475 to $1.1014 keeps the rising channel intact and sets up another push toward the nearest resistance at $1.2060.
Bear case: A close below the EMA cluster and the channel's lower boundary would put the recent uptrend in doubt, opening the door toward $1.0813 and eventually the $0.9513 structural floor.
Polkadot Price Prediction: Can $DOT Really 10X From Here?
DOT hitting a 10x from here would mean going from around the trading price of $1.1665 to roughly $11-12.
That's technically possible over the long term if the broader crypto market cycle turns strongly bullish and Polkadot's adoption grows significantly, but nothing on the current chart points to that happening on any predictable timeline.
Polkadot Price Prediction: Can $DOT Reach $1.4000?
$1.4000 is the highest resistance marked on the chart, and getting there is a multi-stage climb rather than a single move.
DOT would first need to reclaim $1.2060, then clear $1.2823 before the $1.4000 zone even comes into play.
Each of those levels has acted as a ceiling before, so a break above one doesn't guarantee a break above the next.
Polkadot vs Bitcoin: How Does $DOT Compare?
Like most altcoins, DOT's short-term price action tends to track the broader market mood set by Bitcoin.
When Bitcoin price prediction models point to a stable or rising BTC, altcoins like Polkadot typically get more room to run on their own chart setups.
When BTC turns choppy, moves like DOT's current pullback tend to get sharper and support levels get tested faster.
Polkadot Price Prediction 2026: Expert View
According to CoinGabbar analysts, The pullback from the channel high looks more like a routine test of support than a full reversal so far, since price is still sitting right on top of the EMA cluster rather than breaking cleanly below it.
The $1.1475 to $1.1014 zone is the real battleground here, and how DOT reacts there over the next few candles should set the tone for whether the channel uptrend continues or starts to unwind.
Disclaimer
This piece is for informational purposes only and isn't financial advice. The levels discussed here are based on chart analysis at the time of writing, and crypto markets can shift quickly, so nothing here should be treated as a guarantee. It's worth doing your own research and weighing your own risk tolerance before making any decisions.
















