Kiyosaki Says Central Banks Are Dumping US Bonds for Gold. Here’s Why?


Gold is trying to bounce after its sharpest drop in weeks, with one trader arguing the recovery is "just a matter of time" once oil prices ease.
This Gold Price Prediction looks at whether $4,184.69 holds and gold can climb back toward the EMA cluster overhead.
Gold News Today: Gold's Recovery Is "Just a Matter of Time"
A social media post argued gold will come back, tying its recent weakness to high oil prices, which keep inflation expectations elevated and push bond yields higher, both of which pressure gold.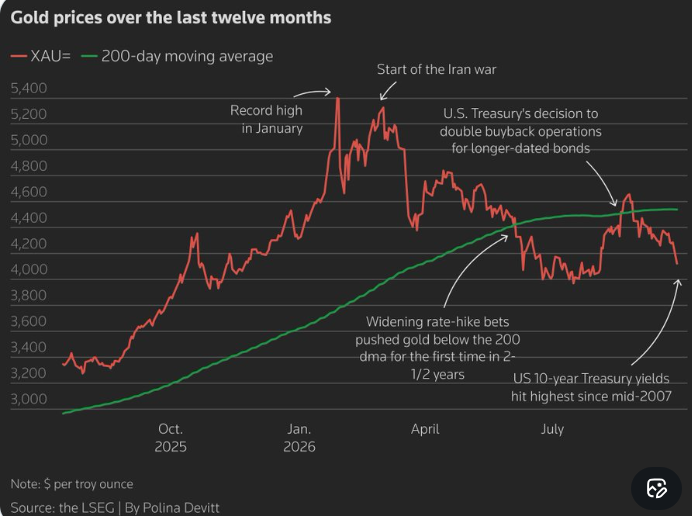
The post said oil should soon ease as Gulf exports normalize, which would let yields fall and let gold recover, calling it "just a matter of time." This is one trader's macro view rather than confirmed analysis, and CoinGabbar could not independently verify the Gulf export claim behind it.
Gold News: Kiyosaki Warns Central Bank Bond Dumping Could Crash Stocks
CoinMarketCap reported that Robert Kiyosaki, author of Rich Dad Poor Dad, said central banks dumping U.S. bonds in favor of gold could crash the S&P 500 and leave millions of Baby Boomers homeless, and he urged people to buy gold, silver, and Bitcoin.
Kiyosaki is a well-known public commentator, and this reflects his own stated view rather than a confirmed market forecast.
Gold Price Today: Technical Analysis
Gold fell sharply in the last week of September, dropping from around $4,300 to a low near $4,165 before today's small bounce. Gold price today is up 0.12% to $4,187.57.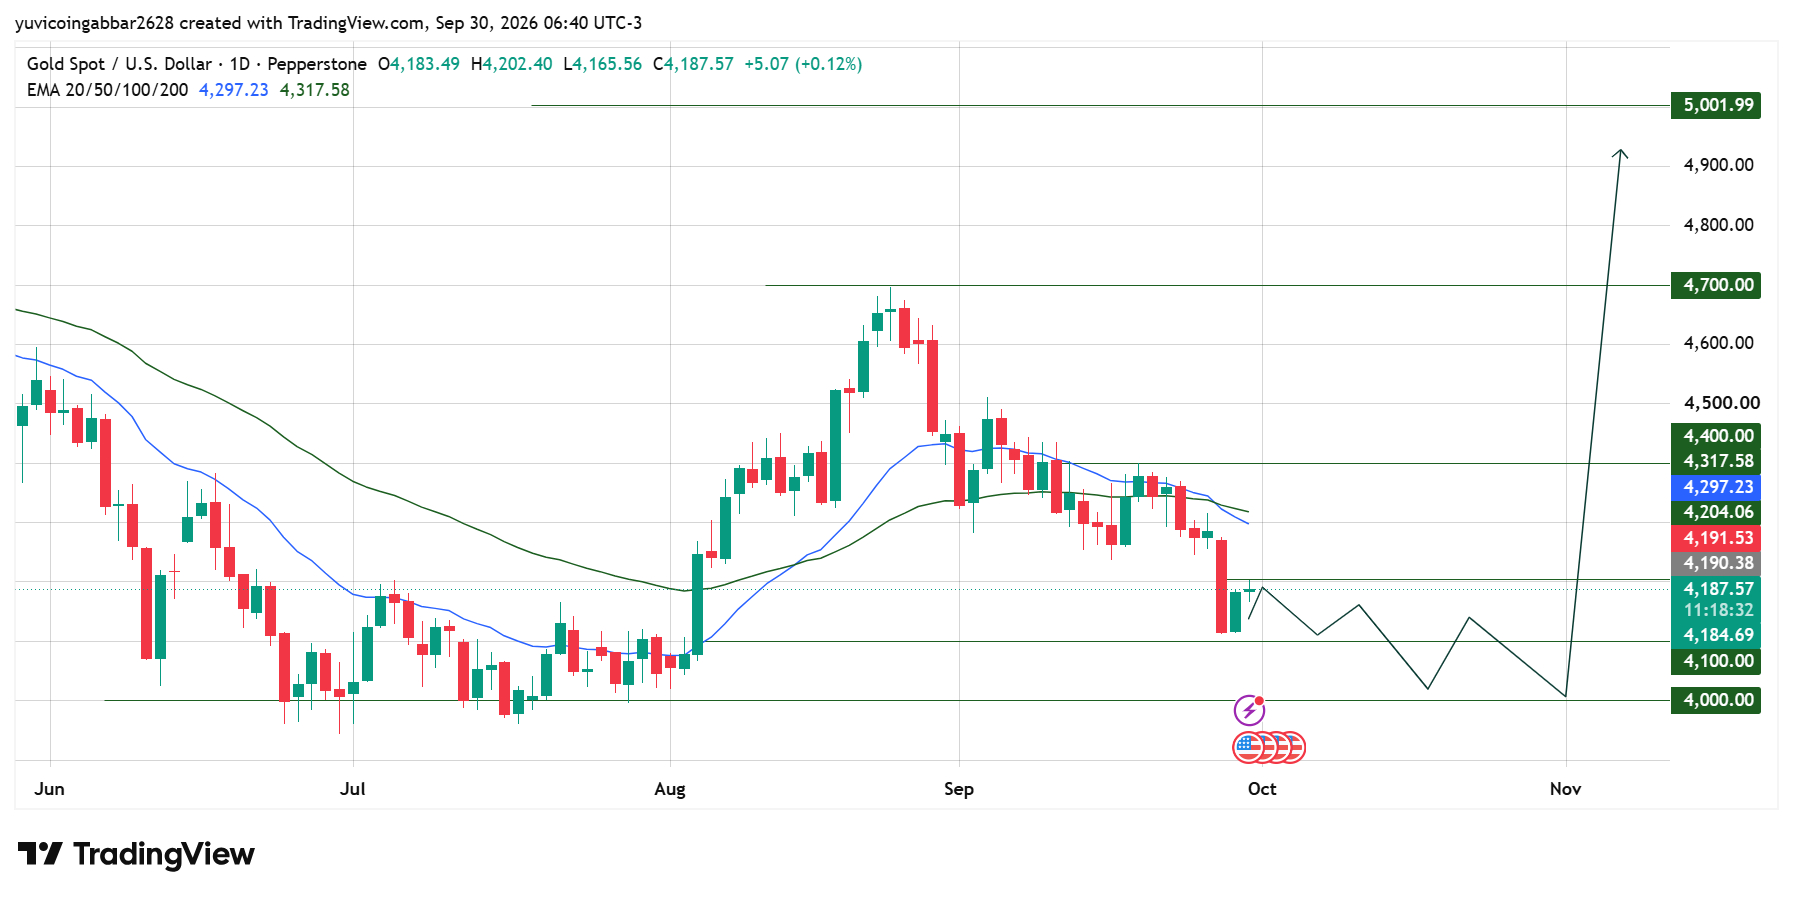
Price is trying to hold the $4,184.69 zone after that drop, but it remains well below both EMAs.
The 20 EMA sits at $4,297.23 and the 50 EMA at $4,317.58, close together just above price, forming a resistance cluster that gold would need to clear to signal a real trend change rather than a brief bounce.
Below the current price, $4,100.00, and then $4,000.00 are the next support levels if this attempt fails.
Gold Outlook Key Levels
Level Type | Price |
Resistance 3 | $5,001.99 |
Resistance 2 | $4,700.00 |
Resistance 1 | $4,400.00 |
Immediate Price Reference | $4,187.57 |
First Confirmed Support | $4,184.69 |
Deeper Support | $4,100.00 |
Structural Floor | $4,000.00 |
Gold Forecast
Bull case: If the price holds $4,184.69, today's bounce could be the early stage of a recovery, especially if oil prices ease, as the trader argued.
A close back above the EMA cluster near $4,317.58 would be the first real technical sign of a trend change, with $4,400.00 the next target after that.
Bear case: A close below $4,184.69 would suggest the bounce has failed, opening the way toward $4,100.00 and then $4,000.00.
Macro arguments about future oil relief don't change what the chart shows until price actually confirms it.
Gold Price Prediction: Can Gold Reach $5,000?
$5,001.99 is the highest level marked on the chart. To get there, gold would first need to hold $4,184.69, reclaim the EMA cluster near $4,317.58, and then clear both $4,400.00 and $4,700.00. That's a long path from a chart that's still trying to confirm today's small bounce.
Gold Price Prediction 2026: Expert View
According to CoinGabbar analysts, Today's 0.12% gain is a small step, not a confirmed reversal, and the EMA cluster just overhead is the real test of whether this bounce has legs.
The oil-and-yields recovery thesis is a reasonable macro argument, and Kiyosaki's central bank warning adds to the bullish narrative around gold generally, but neither changes the fact that $4,184.69 is the level the chart needs to hold first.
Disclaimer
This piece is for informational purposes only and isn't financial advice. The levels and scenarios above are based on technical chart analysis and publicly available data at the time of writing. Gold prices can move sharply on macro and geopolitical news, so past patterns don't guarantee future outcomes. Do your own research and consider your risk tolerance before acting on any level discussed here.











.webp)










