ARK Price Prediction October 2026: Can $ARK Extend Its Gains?


ARK broke out of a descending channel and trades at $0.2963, up 20.33% in 24 hours.
Whether that move extends into October 2026 defines this ARK price prediction, which sits beside price prediction coverage.
Data is timestamped 09:21 UTC on September 30, 2026. Levels come from the ARK/USDT daily chart on Binance.
$ARK Price Today
Current $ARK Price and Market Snapshot
ARK gained 20.33% in 24 hours. Volume surged 455.1%. Rank stands at #342.
CoinMarketCap data at 09:21 UTC shows the snapshot below.
Metric | Data |
Price | $0.2963 |
24H change | +20.33% |
7D change (Coinglass) | +89.32% |
Market cap | $59.09M |
24H volume | $33.9M |
Circulating supply | 199.45M ARK |
Total supply | 199.45M ARK |
ATH | $10.91 (Jan 9, 2018) |
Distance from ATH | -97.19% |
Coinglass reported $0.2979 and a $61.05M market cap. Update timestamps differ, so CoinMarketCap serves as the base snapshot.
$ARK DeFAI vs. Original $ARK
ARK DeFAI shares the ticker but not the asset. CoinMarketCap lists it near $6.41 with a $20M market cap.
Asset | Original ARK | $ARK DeFAI |
Focus | Modular Layer-1, DPoS | DeFAI, AI governance |
Network | ARK Network | BNB Smart Chain |
Approx. price | $0.30 | $6.41 |
This analysis covers the original $ARK, since every chart is ARK/USDT. Contract addresses separate the two, which matters when following AI crypto news.
$ARK Technical Analysis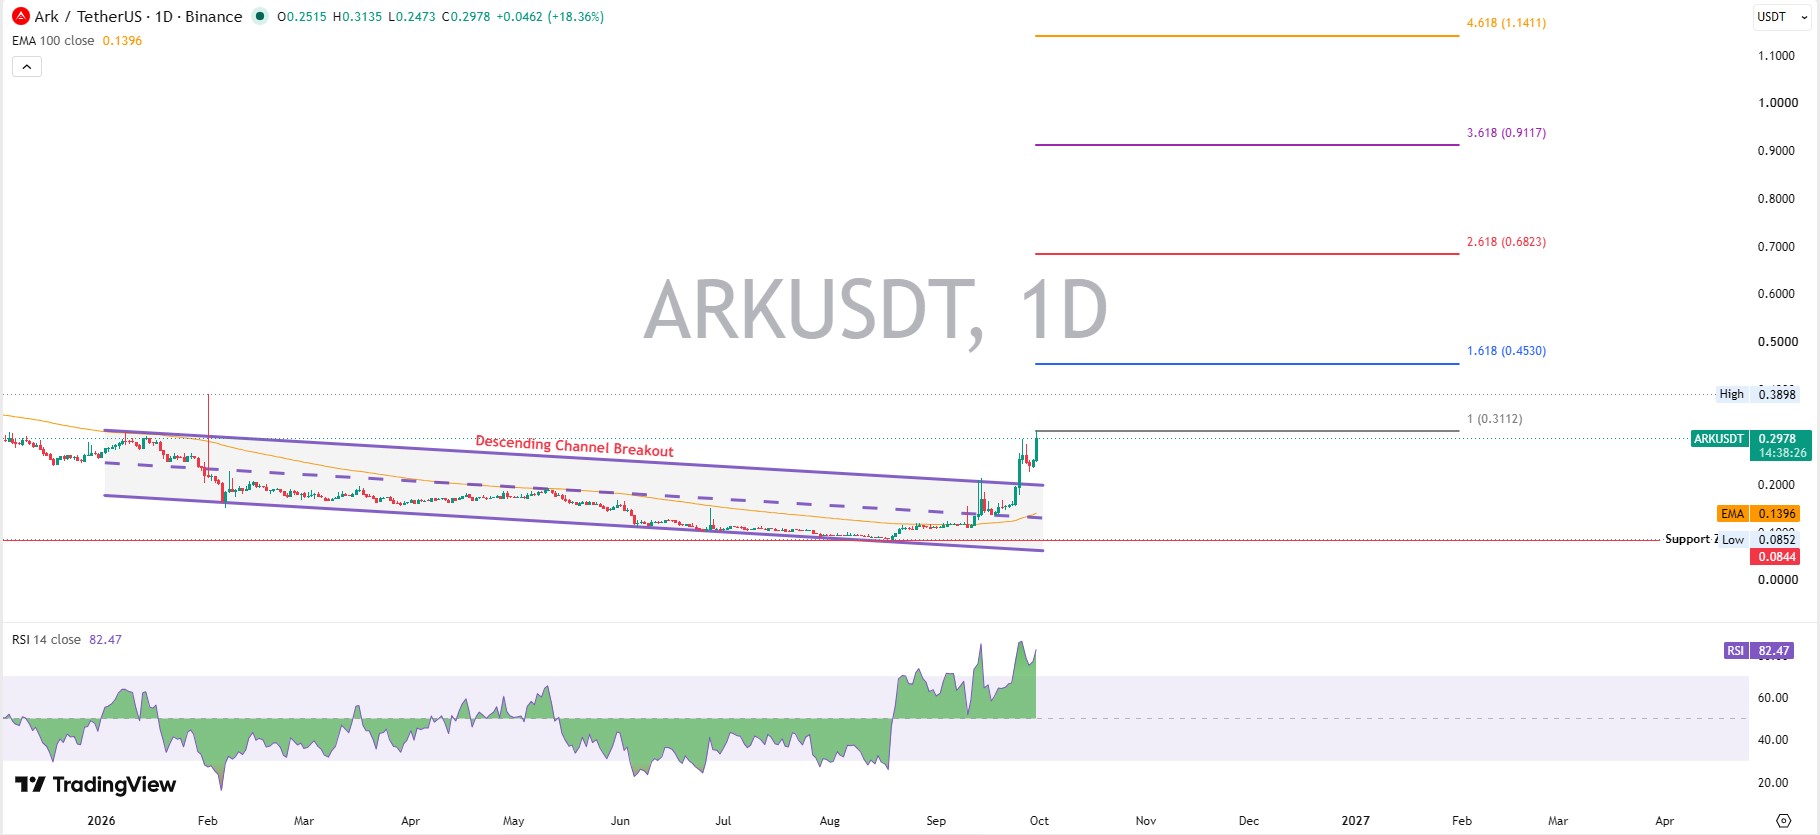
ARK Trend
On the daily chart, ARK/USDT cleared a descending channel that guided the price lower from February 2026.
Price rose from a $0.0852 low in August to near $0.30, per the TradingView daily chart.
Trades now sit above the 100-day EMA at $0.1396.
Higher highs and higher lows have formed since late August. And the breakout is recent.
$ARK RSI
RSI reads 82.47. Above 70 is overbought territory.
But overbought isn't a reversal signal. Speculative flows, tracked in meme coin news, can keep readings elevated.
$ARK MACD
MACD reads 0.0385 against a signal line of 0.0273.
The histogram shows 0.0112, above zero, so momentum is accelerating. And a shrinking histogram would flag deceleration first.
ARK Volume Analysis
Volume reached $33.9M on CoinMarketCap, or 51.32% of market cap.
Coinglass derivatives data adds $26.07M spot volume, $84.42M futures volume, and $25.67M open interest.
Rising volume alongside a breakout confirms it better than falling volume does.
Can spot volume keep pace with futures?
$ARK Support and Resistance Levels
Immediate Resistance
Immediate resistance sits at $0.3112, the 1 Fibonacci extension. The breakout level is $0.3898.
Immediate Support
Immediate support is $0.242, the 24-hour low, while major support at $0.20 marks the channel's upper edge.
Invalidation Level
A sustained daily trade below $0.20 would weaken the breakout thesis and expose $0.1396.
$ARK Price Prediction for October 2026
Ranges below can shift with events on the coin events calendar.
Bull Case
Sustained trades above $0.3898 with rising volume could open $0.4530 (1.618 extension) and $0.6823 (2.618). Invalidation: trades below $0.242.
Base Case
Price stays between $0.24 and $0.39 as momentum cools and support remains intact. Invalidation: trades below $0.20.
Bear Case
A break below $0.20 with falling volume and a bearish MACD crossover could expose $0.1396, then $0.0852. Invalidation: recovery above $0.3112.
What Could Drive $ARK Higher?
Protocol Development
ARK's official update on September 24, 2026, detailed RANDAO validator selection (a random-number method), an EVM aligned with Ethereum's Osaka spec, and a public testnet due mid-October.
Liquidity and Exchange Activity
Upbit carries 52.43% of listed volume, so concentrated liquidity can steer price. And new exchange listing updates could widen access.
$ARK Tokenomics and Supply
CoinMarketCap lists 199.45M circulating and total supply with no max supply. FDV of $58.99M nearly matches market cap, so dilution from locked tokens is minimal.
But the missing cap leaves issuance rules open, and crypto airdrops can also shift circulating supply.
$ARK Risks
$ARK gained 172.47% in 30 days but lost 28.95% over 1 year, which shows the volatility. Liquidity concentration, no stated max supply, network upgrade risk, and Bitcoin weakness add pressure.
Competition from new presale and ICO launches for speculative capital adds narrative risk. Forecast models stay uncertain.
Disclaimer: This article is for informational purposes only and isn't financial advice. Cryptocurrency prices are volatile, and technical indicators are evidence, not certainty. Verify data independently before making any decision.










.webp)











