Algorand Price Prediction August 2026: $ALGO Buy, Sell, or Wait?

A blockchain built for speed just went quiet, and quiet charts make people nervous. When a token drifts sideways for weeks, the question that always comes back is simple: Is this the calm before a move, or just fading interest dressed up as consolidation? Two fresh posts from the project team this week gave holders something to chew on while the price barely blinked.
Algorand Price Prediction August 2026: Why ALGO Getting Overlooked
This Algorand price prediction August 2026 matters because $ALGO rarely shows up in the headlines anymore, even as its own foundation keeps posting and pushing real-world efforts like the recent Algorand university expansion in India.
That's the tension right now.
The chart says one thing. The roadmap talk says another thing. A real algo price prediction has to weigh both before saying anything about ALGO's future price. Is $ALGO oversold right now, or is there more room to fall? Ready to see what the data actually shows?
Key Takeaways
ALGO price today sits near $0.07889, up 2.06% intraday but down 7.07% on the current weekly candle, as of July 31, 2026, 04:00 UTC.
Daily RSI reads 37.66; weekly RSI sits at 39.03, both leaning weak, not oversold, which answers the "Is Algorand oversold right now?" question directly: not yet.
The daily chart is stuck inside a descending channel; the weekly chart shows a falling wedge, still unresolved, key to any Algorand short-term forecast.
Algorand liquidation data shows 24h liquidation of just $9.39K, with shorts taking $8.17K of that, a thin, low-drama tape.
Circulating supply sits at 8.96B ALGO of a 10B max supply, per CoinMarketCap, and network data from Allo.info shows 89.69% of the supply is already circulating.
The catalyst behind this Algorand forecast for August 2026 is a CEX-access push and a decentralization stats post, not a listing or partnership.
Why Is Algorand Price Falling Today
Here's the thing: there isn't one big catalyst driving this Algorand price prediction for August 2026; there are two small ones stacked together.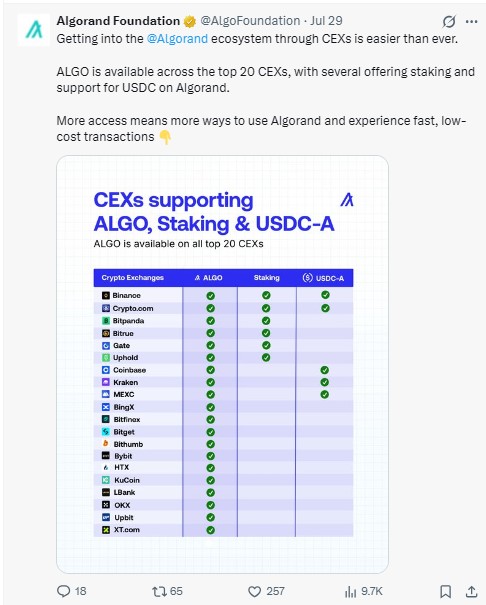
First, Algorand Foundation posted that $ALGO now trades across all top 20 centralized exchanges, several offering staking and USDC-A support. That's an accessibility story, not a demand shock.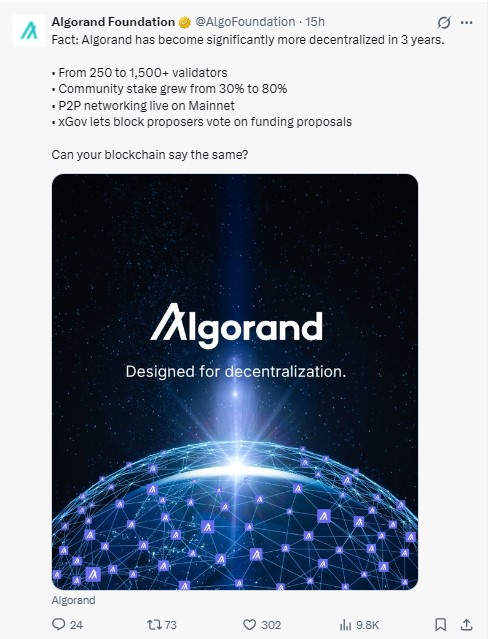
Second, a separate Foundation post touted decentralization gains: validators grew from 250 to over 1,500, and community stake climbed from 30% to 80%. Good optics. But optics rarely move price on their own, and that's what is driving the ALGO price this month more than anything else.
And the liquidation data backs that up. Just $9.39K in 24-hour liquidation, per CoinGlass, tells us leverage isn't stretched either direction right now.
For more day-to-day updates like this, check our crypto news coverage.
Algorand Technical Analysis: Daily and Weekly Chart Analysis
Daily Chart Analysis
On the daily chart, ALGO trades inside a descending channel that's held since April. Price opened at $0.0789, hit a high of $0.0810, and closed near $0.0790, roughly flat.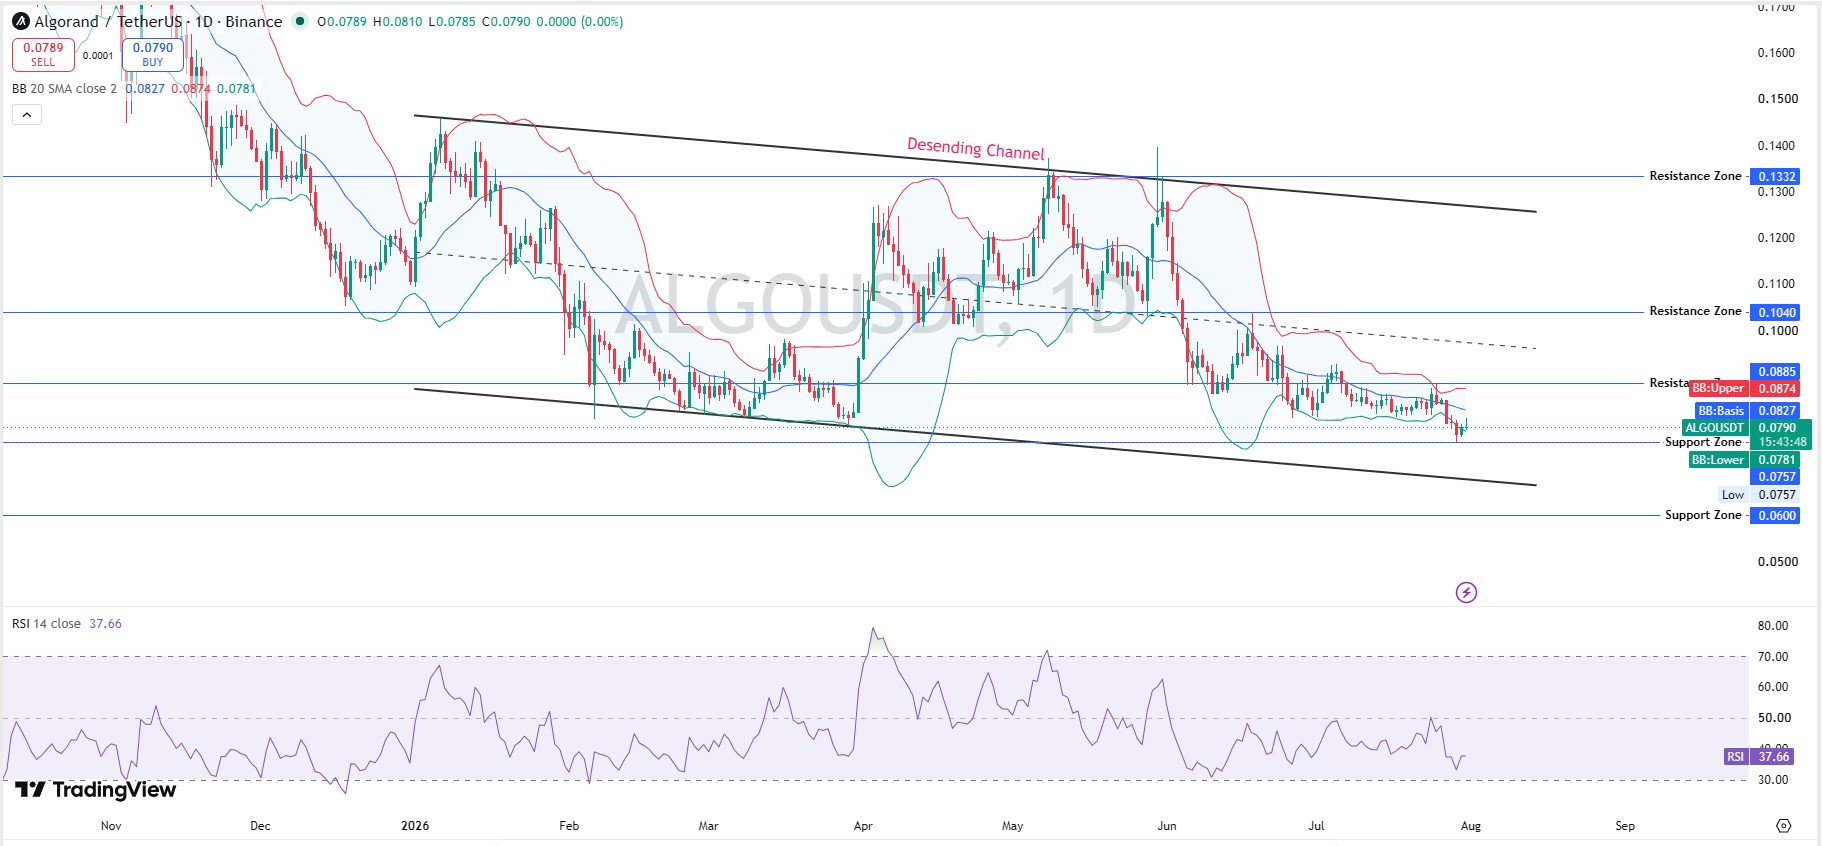
Daily RSI at 37.66 sits below neutral, not yet oversold. The daily Bollinger Bands show a basis at $0.0827, an upper band at $0.0885, and a lower band at $0.0781, so the price is hugging the lower band. That's pressure, not panic.
The Algorand resistance level to watch sits at $0.1040, then $0.1332. The ALGO support level holds near $0.0757, the daily low, then $0.0600.
Weekly Chart Analysis
The weekly chart tells a rougher story for this $ALGO monthly forecast. $ALGO closed the week down 7.07%, from $0.0849 to $0.0789, inside a falling wedge that's compressed since late 2024.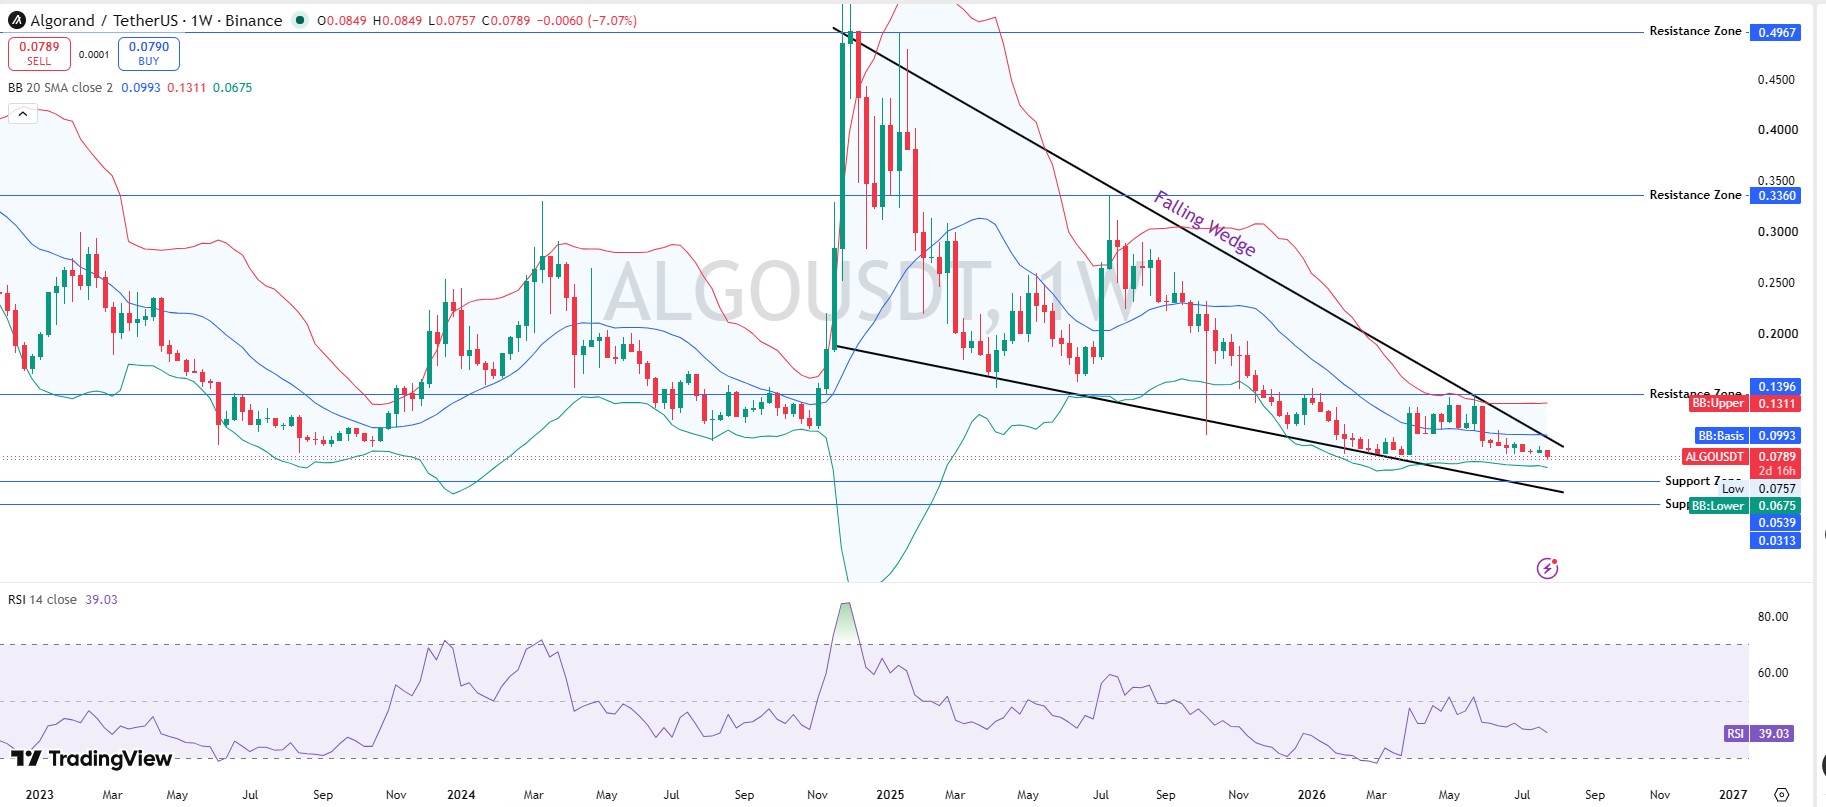
Weekly RSI at 39.03 confirms the softness without confirming a bottom. Weekly Bollinger Bands read a basis of $0.0993, an upper of $0.1311, and a lower of $0.0675. Price sits well under its own average here.
A weekly close above $0.0885 would matter for any bullish Algorand technical analysis. A close under $0.0675 would matter more and not in a good way.
Algorand Support and Resistance Levels
Resistance: $0.0885, then $0.1040, then $0.1332, then a distant $0.3360 zone.
Support: $0.0757 (24h low), then $0.0675, then $0.0600.
Losing $0.0757 on a daily close would put this consolidation thesis in doubt for any short-term forecast this month.
If you're comparing setups across coins, our price prediction hub tracks similar support and resistance breakdowns.
Tokenomics and Network Snapshot
ALGO's market cap sits at $707.62M, with FDV at $788.9M, per CoinMarketCap. Total and max supply both cap at 10B ALGO, with 8.96B already circulating, roughly 89.69% per Allo.info network data. Block time runs 2.747 seconds, processing 10.8 transactions per second.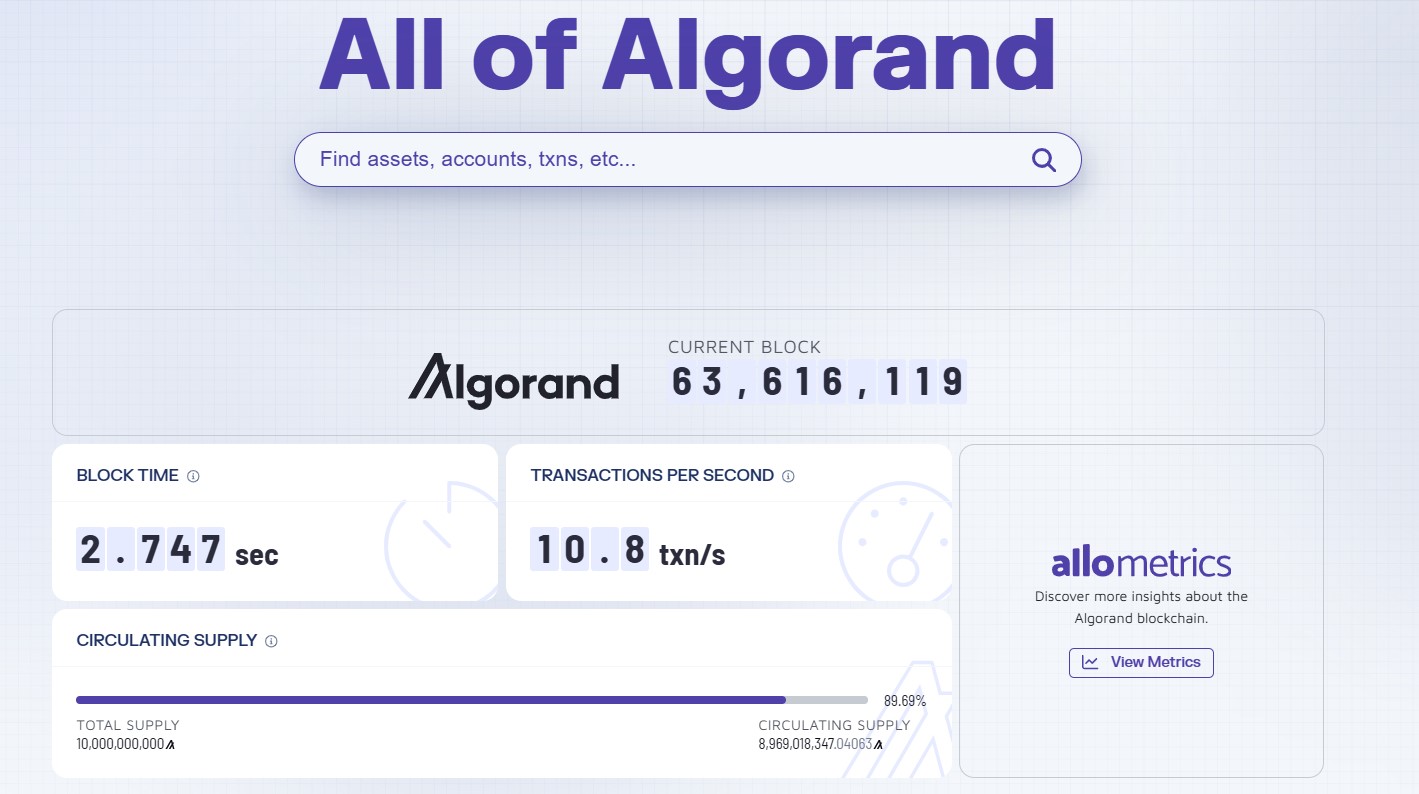
Vol/Mkt Cap sits at 2.31%, a light ratio. That's not aggressive trading, that's drift, and it matters for anyone working out an algo valuation right now.
Where ALGO Is Actually Trading
Binance leads futures volume at $8.81M, per CoinGlass, followed by LBank ($5.35M), Bybit ($4.18M), OKX ($3.30M), and BingX ($2.46M). None of this is heavy volume for a top-65 asset.
Worth watching alongside our crypto exchange listing tracker for where new liquidity tends to show up first.
Algorand Price Target: Scenarios By Timeframe
Timeframe | Bull Case | Base Case | Bear Case |
24H | Reclaims $0.081, tests $0.0885 (moderate) | Holds $0.076-$0.079 range (high) | Slips under $0.0757 (low) |
7D | A weekly close above $0.0885 reopens $0.104 (low-moderate) | Range $0.0675-$0.085 (high) | Breaks $0.0675, retests $0.0539 (low-moderate) |
August 2026 | CEX expansion and staking access drive ALGO toward $0.10-$0.13, a realistic ALGO price target this month (low-moderate) | Drifts $0.07-$0.09 with sector sentiment (moderate) | Fades toward $0.06-$0.065 on low usage (low-moderate) |
Invalidation for any bullish read is a daily close under $0.0757. These are directional reads tied to probability, not guarantees, and they're the core of this Algorand price prediction for August 2026.
Any confirmed exchange or partnership news would shift this fast, so it's worth checking our coin events calendar for upcoming catalysts.
Is Algorand a Good Investment Right Now
That depends on risk tolerance, and it's the honest answer to whether it's too late to buy ALGO in August 2026. Low volume is the first flag. A thin Vol/Mkt Cap ratio means moves in either direction can happen fast on light volume.
Narrative dependence is the second. Both recent catalysts are foundation marketing, not confirmed usage growth or listings. Can ALGO recover in 2026? Possibly, but it needs real transaction growth, not just posts about decentralization.
For broader market context, see our Bitcoin price prediction 2026 coverage.
Glossary
RSI (Relative Strength Index): A 0-100 momentum gauge; under 30 usually signals oversold conditions.
Bollinger Bands: Bands around a moving average that widen with volatility; price near the lower band signals pressure.
Descending Channel / Falling Wedge: Compression patterns; a falling wedge often resolves upward, and a channel can break either way.
FDV (Fully Diluted Valuation): What the market cap would be if every token were circulating.
Terms like these matter for anyone comparing ALGO against other majors, including our Ethereum price prediction 2026 coverage.
Methodology
Chart levels came from ALGO/USDT daily and weekly charts on Binance via TradingView, using RSI-14 and 20-period Bollinger Bands, captured on July 31, 2026, at 04:00 UTC. Supply and market data came from CoinMarketCap. Network stats came from Allo.info. Liquidation and futures volume came from CoinGlass.
For fresh token launches worth tracking alongside this one, our crypto airdrops tracker stays updated.
Disclaimer: This is speculative market commentary, not financial advice. Crypto assets are volatile. Data is current as of July 31, 2026, 04:00 UTC; verify live figures before trading.











.jpg)






