Fabric Protocol Price Prediction: Bullish Reversal or More Downside?


$ROBO just staged a sharp bounce off its recent lows, but the 1H chart is now cooling off right into its EMA cluster while the daily chart is still fighting to reclaim a trendline it lost back in July.
Fabric Protocol is the project behind ROBO, and this Fabric Protocol Price Prediction breaks down whether this turns into a genuine reversal or fades back into the broader downtrend.
Here's what the short-term and long-term charts show.
Fabric Protocol Price Prediction Today: Market Overview
Metric | Value |
Price | $0.01247 |
24h Change | 10% |
Market Cap | $27.78M |
Unlocked Market Cap | $33.11M |
Fully Diluted Valuation (FDV) | $124.51M |
24h Volume | $16.0M+ |
Vol/Mkt Cap (24h) | 57.14% |
Liquidity/Mkt Cap | 4.84% |
Total Supply | 10B ROBO |
Max Supply | 10B $ROBO |
Circulating Supply | 2.23B $ROBO |
Holders | 34.94K |
Source: Data from CoinMarketCap as of 4/08/2026. Figures may vary slightly across other tracking websites.
ROBO Token Unlocks: What It Means for Price
As of August 4, 2026, at 09:06:08 AM, 26.59% of ROBO's total supply (2.65B tokens, worth $33.12M) is unlocked, while 73.41% (7.34B tokens) remains locked, according to figures reported directly by the project. 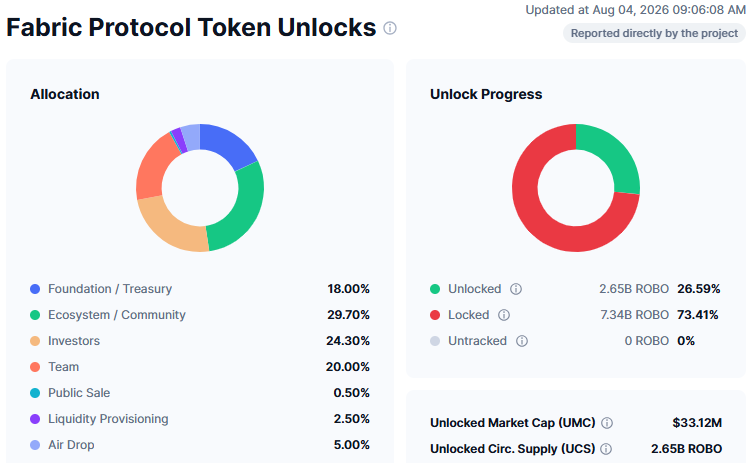
Allocation is spread across Ecosystem/Community (29.70%), Investors (24.30%), Team (20%), Foundation/Treasury (18%), Airdrop (5%), Liquidity Provisioning (2.50%), and Public Sale (0.50%).
With close to three quarters of supply still locked, upcoming unlock events tied to the investor and team allocations remain a source of potential sell pressure that could weigh on any recovery attempt regardless of what the charts show.
ROBO Price Prediction Chart: Short-Term Technical Analysis
Pair: ROBO/USDT · Market: Spot (Crypto) · Exchange: Binance · Timeframe: 1H · Source: TradingView · Timestamp: August 4, 2026, 09:41 UTC+5:30
The 1H $chart shows ROBO trading at $0.01247 after a volatile session that saw the price break out of a descending channel, rallying from around $0.01150 to a high near $0.0139.
Price has since faded back toward the $EMA (Exponential Moving Average, a momentum indicator that weights recent candles more heavily) cluster.
With the shorter 20 $EMA at $0.01262 sitting just above the current price and the longer 50 EMA at $0.01228 just below it, a tight zone that is now acting as a near-term pivot separate from the horizontal support and resistance on the $chart.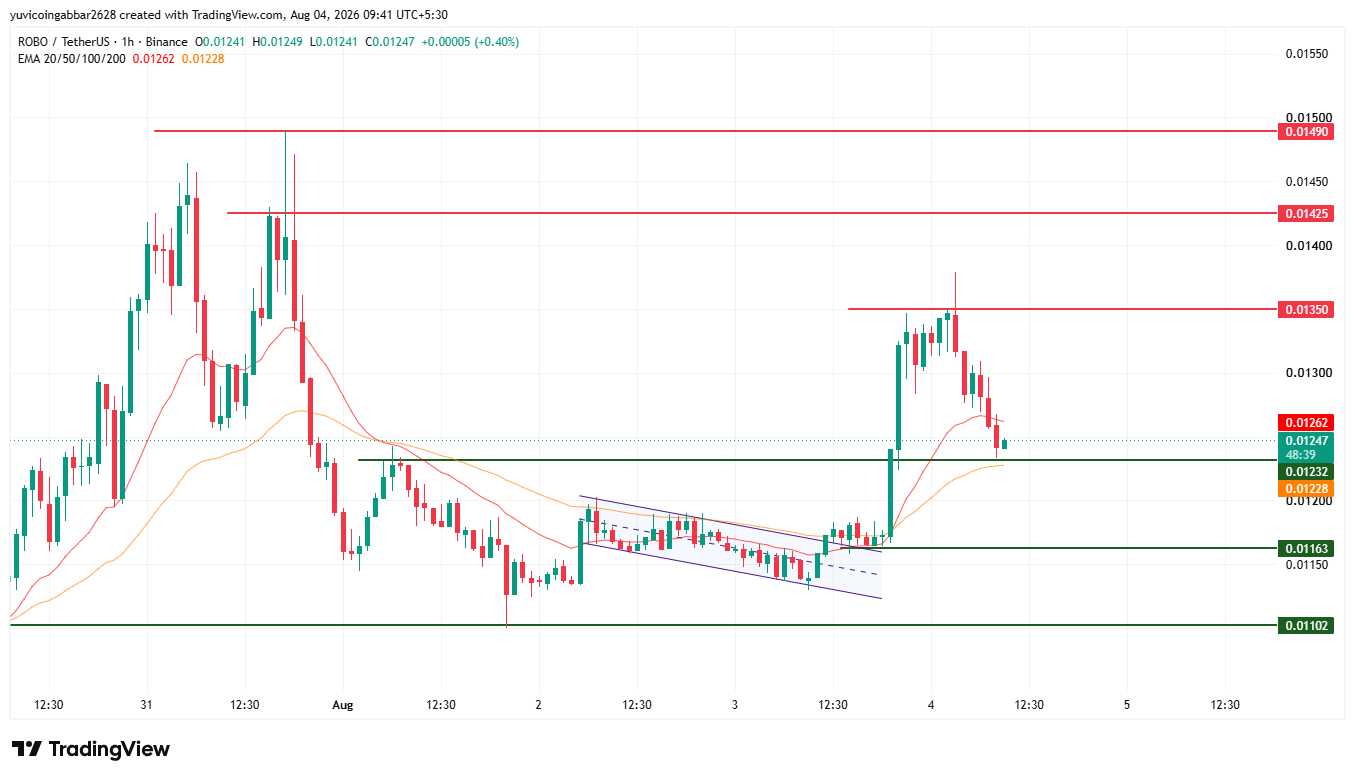
If the price breaks the nearest support and resistance, then what are the key levels to watch?
Level Type (Short-Term, 1H) | Price |
Resistance 3 | $0.01490 |
Resistance 2 | $0.01425 |
Resistance 1 (nearest) | $0.01350 |
EMA 20 | $0.01262 |
Immediate Price Reference | $0.01247 |
EMA 50 | $0.01228 |
First Support | $0.01232 |
Deeper Support | $0.01163 |
Structural Floor | $0.01102 |
Fabric Protocol Price Prediction Chart: Long-Term Technical Analysis
Pair: ROBO/USDT · Market: Spot (Crypto) · Exchange: Binance · Timeframe: 1D · Source: TradingView · Timestamp: August 4, 2026, 09:47 UTC+5:30
On the daily $chart, after breaking down from an ascending trendline that had supported the price since April.
That breakdown in early July triggered a steep slide from around $0.0180 to a low near $0.01075, and the price has since attempted a recovery, bouncing to roughly $0.0143 before retreating.
$EMA readings on the daily are stacked at $0.01236 and $0.01421, with the longer $EMA still well above the current price and acting as a heavier overhead resistance than the shorter one, which price has briefly reclaimed.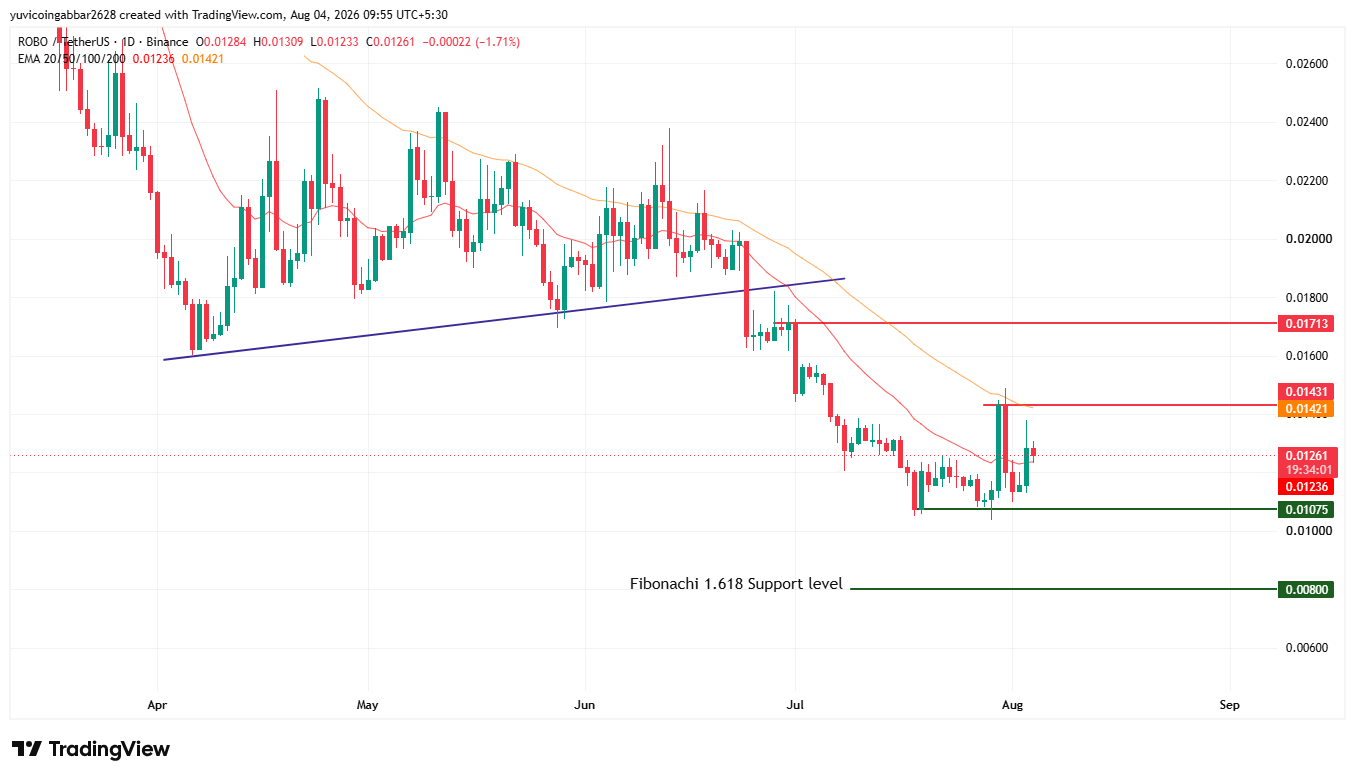
Level Type (Long-Term, 1D) | Price |
Resistance 2 | $0.01713 |
Resistance 1 (recent swing high) | $0.01431 |
EMA (50) | $0.01421 |
EMA (20) | $0.01236 |
First Support | $0.01075 |
Deeper Support (Fib 1.618 extension) | $0.00800 |
Fabric Protocol Forecast: Bull Case vs. Bear Case
ROBO price target 2026 Bull case: Holding above the 1H first support at $0.01232 and clearing $0.01350 would be the sign that short-term momentum is turning back up.
On the daily $chart, a daily close back above the $0.01421 $EMA zone and eventually $0.01713 would put the broader downtrend structure genuinely in question.
ROBO price target 2026 Bear case: A break below $0.01232 followed by $0.01163 would suggest the recent bounce was a relief rally rather than a reversal.
On the daily chart, losing the $0.01075 support would put the deeper Fibonacci 1.618 extension level near $0.00800 back in play.
ROBO price target: Can ROBO Reach $0.01713?
$0.01713 is the highest resistance level marked on the long-term $chart, sitting well above the current price at $0.01247.
Reaching it would require ROBO to first hold the short-term EMA cluster, then reclaim the daily EMA zone at $0.01421, and finally clear the $0.01431 recent swing high before testing this upper resistance zone, a multi-stage move rather than a single leg.
What Could Invalidate the Bullish Setup?
A rejection at the 1H $EMA cluster ($0.01228 to $0.01262) followed by a loss of $0.01232 would put the recent bounce in doubt on the short-term chart.
More significantly, a daily close below $0.01075 would undermine the recovery attempt entirely, opening a path toward the $0.00800 Fibonacci extension support.
Fabric Protocol Price Prediction Methodology
This forecast draws on multiple inputs rather than a single chart pattern: the short-term channel breakout and EMA cluster test, the long-term trendline breakdown and resistance zone, the token unlock schedule, and broader liquidity conditions.
As a quick risk-reward reference on the short-term setup, entering near the current $0.01247 with a stop below the $0.01163 deeper support (risk of about $0.00084) against a level at the $0.01350 resistance (a reward of about $0.00103) works out to a roughly 1:1.2 risk-reward ratio before accounting for slippage or fees.
No single signal here is treated as decisive on its own.
Fabric Protocol Price Prediction: Expert View
According to CoinGabbar analysts, the short-term and long-term charts are telling a mixed story right now.
The 1H chart shows a genuine bounce that has cooled into an EMA test, which is a normal pause rather than an outright rejection so far.
The daily chart is the bigger question mark, since ROBO is still trying to recover from a trendline breakdown that erased more than a third of its value in about a month.
The $0.01232 to $0.01350 zone is the near-term battleground on the short-term chart, while $0.01421 remains the level that would need to fall on the daily chart before this starts looking like a genuine reversal rather than a bounce inside a larger downtrend.
Fabric Protocol Price Prediction: Data Sources
Short-term price and EMA data referenced from a 1H ROBO/USDT chart via TradingView on Binance, timestamped August 4, 2026, 09:41 UTC+5:30.
Long-term price and EMA data referenced from a 1D ROBO/USDT chart via TradingView on Binance, timestamped August 4, 2026, 09:47 UTC+5:30.
Market cap, FDV, volume, supply, and holder data referenced from CoinMarketCap. Token unlock data reported directly by the Fabric Protocol project, updated August 4, 2026, 09:06 AM.
Disclaimer: This piece is for informational purposes only and isn't financial advice. The levels and scenarios above are based on technical chart analysis and publicly available data at the time of writing, and crypto markets can move sharply within hours, so past patterns don't guarantee future outcomes. It's worth doing independent research and considering your own risk tolerance before acting on any of the levels discussed here.


















