Shiba Inu Price Prediction: $SHIB Next Big Move Could Surprise Traders


Shiba Inu started as a joke back in 2020, an Ethereum-based token built to be the "Dogecoin killer."
It never quite dethroned DOGE, but it built one of the largest and most loyal communities in crypto anyway, complete with its own ecosystem, Shibarium.
Years later, $SHIB is still miles below its 2021 all-time high, and traders keep asking the same question every month.
This Shiba Inu Price Prediction looks at where the token stands today, currently trading around $0.00000499, and what the road ahead might look like from here.
Shiba Inu Price Prediction: Live Market Data
$SHIB is currently sitting at $0.00000499, up 2.9% on the day.
Market cap comes in around $2.936B, with a fully diluted valuation at $4.983B. 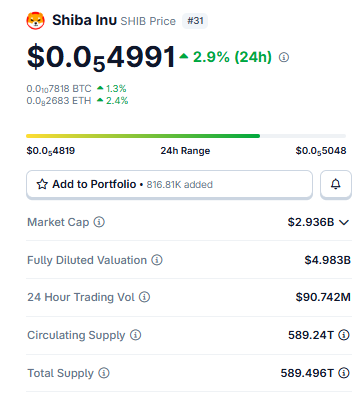
Source: $SHIB Market Cap Data Taken From Coingecko, data as of Aug 04, 2026. Figures may vary slightly across other tracking websites.
That gap isn't huge, which tells you most of the supply is already out there: 589.24T of a 589.496T total.
No looming unlock cliff waiting to dump on holders. A daily volume of $90.742M keeps things liquid enough to trust the price action.
Numbers like these are the backbone of any serious Shiba Inu price prediction, not just the chart lines.
On-Chain and Market Drivers
Check the liquidation heatmap , and the story gets interesting. Over the last 24 hours, roughly $63.49K in short positions got wiped out against just $22.88K in longs.
The 12-hour window shows the same lopsided pattern, $36.61K in shorts versus a tiny $2.97K in longs. 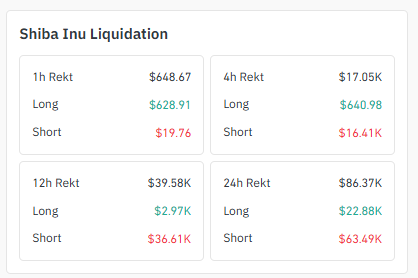
Source: Liquidation Data Taken From Coinglass.
Short sellers keep getting squeezed as the price grinds higher, plain and simple.
The most recent hour flipped that script a little, with longs taking the bigger hit instead. Volatility doesn't pick sides.
Exchange volume tells its own story too. Binance leads at $3.76M; Upbit follows at $3.34M, then Bybit at $2.94M. OKX and Gate add real depth on top of that.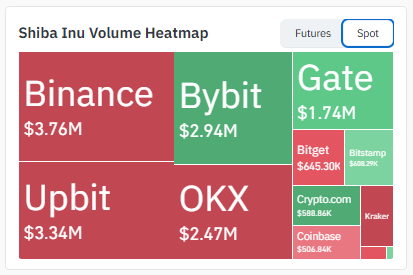
Source: Volume Heatmap Data Taken From Coinglass.
"Spread this wide across major exchanges" usually means genuine demand, not one whale moving size on a thin order book.
Shiba Inu News Today:
A Shiba Inu burn-tracking account recently reported 49,447,707 SHIB burned in the past 24 hours, worth roughly $242 at current prices. Source: Data Taken From @shibburn, X Account. The daily burn rate actually fell 41.02%, meaning the pace has slowed compared to the prior period, with most of the activity landing in one concentrated spike rather than spreading evenly. Burn totals like this rarely move price on their own given SHIB's enormous total supply, but the trend still gets watched as a small piece of the broader supply story. 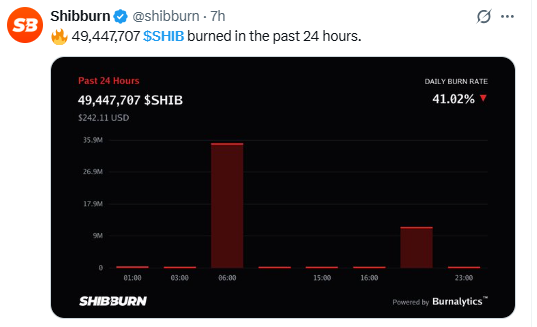
Key Takeaways
-
SHIB is trading at $0.00000499, sitting right below a multi-month descending channel trendline.
-
A close above $0.00000587 would the first sign of a bullish breakout toward $0.00000671.
-
The 200 EMA on the daily chart near $0.00000463 is the line to watch for a bearish breakdown.
-
Short liquidations have outpaced long liquidations over the past 24 hours. That usually means something.
-
Long-term, SHIB still trades far below its 2021 descending channel resistance near $0.00008854.
Technical Analysis of the Shiba Inu Price Prediction
1-Hour Chart Analysis
Zooming into the hourly , $SHIB is squeezed inside a tightening symmetrical triangle. Three rejections off the upper boundary. Two bounces off the lower one. 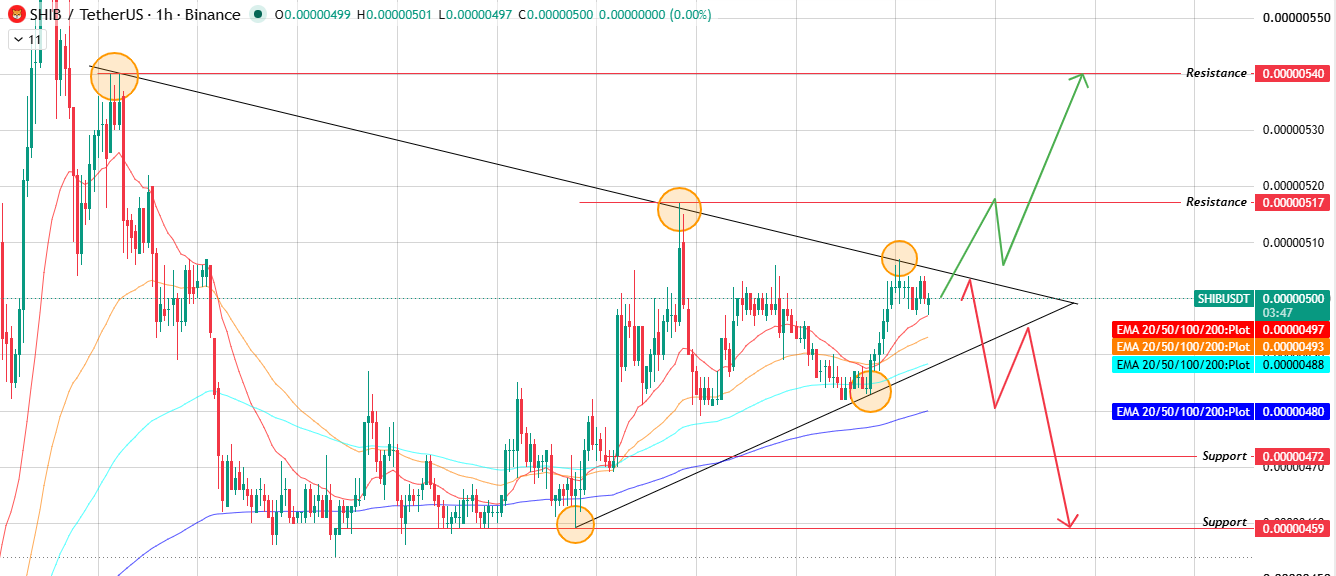
Source: Chart Taken From TradingView.
Volatility is compressing, and structures like this rarely stay quiet for long. Price is holding above its 20, 50, 100, and 200 EMAs for now, which tilts things slightly bullish.
A volume-backed bullish breakout above the upper boundary opens the path to $0.00000517, then $0.00000540.
A bearish breakdown below the lower boundary flips that script fast, sending the price toward $0.00000472 and then $0.00000459.
Daily Chart Analysis
Here's the thing about this trendline:
It keeps winning. $SHIB is respecting a falling, descending trendline that's rejected every rally attempt since the last swing high, and price is currently trading above its short-term 9- and 15-EMAs. 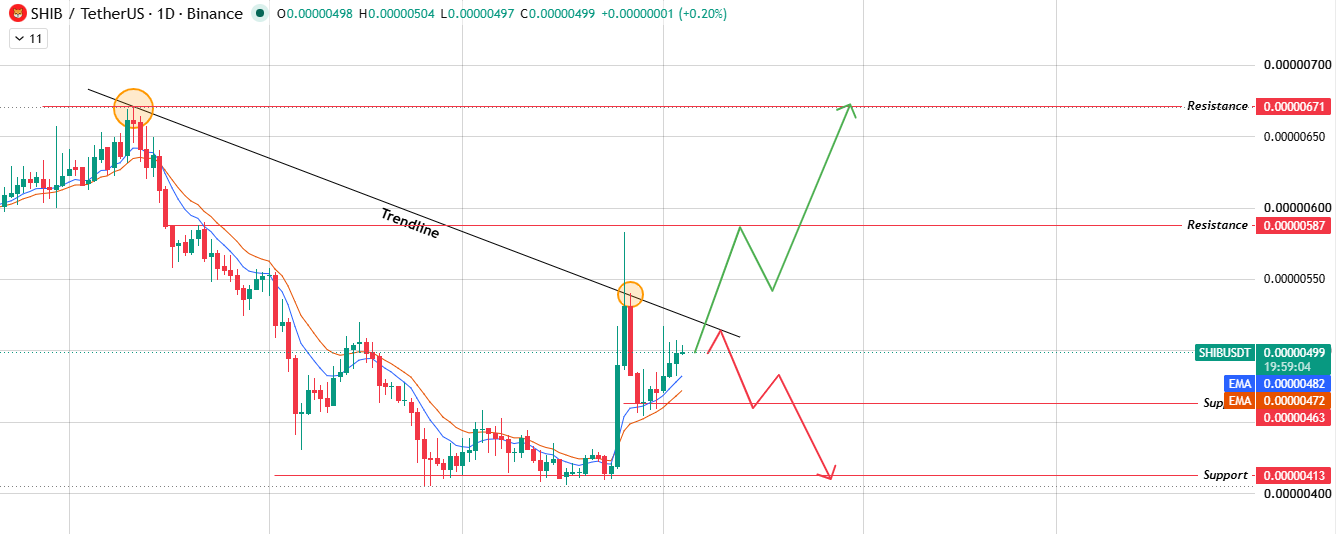
Source: Chart Taken From TradingView.
That's a small win for buyers, nothing more. Break the trendline with real volume behind it, and the move should carry toward $0.00000587 first, then $0.00000671.
Get rejected again from the descending trendline, though, and the pullback lands in the support zone formed by the 9 & 15 EMAs at $0.00000482 and $0.00000463, with a lower demand zone of $0.00000413 waiting underneath if things really unravel.
Bull, Base, and Bear Case
What kills the bull case? A sharp rejection at $0.00000587 on heavy sell volume. What kills the bear case? Buyers reclaiming $0.00000482 and holding it.
Catalysts to Watch
What actually moves the needle from here? Whale accumulation is one to watch.
Large wallets quietly absorbing supply near current levels could add real fuel if a breakout attempt gets going. Then there's the macro angle.
$SHIB's price target often tracks BTC dominance, and a falling dominance chart tends to be good news for altcoins across the board.
ETH correlation still matters too, given SHIB's roots sit firmly in the Ethereum ecosystem.
A strong ETH move rarely leaves SHIB behind. Keep an eye on volume the moment price touches $0.00000587.
A breakout on thin volume looks convincing for about five minutes, then fails.
Long-Term Outlook
Zoom all the way out, and SHIB is still miles from its 2021 high near $0.00008854.
That weekly descending trendline has rejected every meaningful rally since, with no exceptions yet.
A monthly close above current resistance would be a decent first step, sure, but reclaiming the bigger trend probably takes months of higher lows, not one breakout candle and a victory lap.
Long-term holders should really just watch one thing: does SHIB hold above the EMA support zone on pullbacks? Keep failing that retest, and the broader recovery case gets weaker every time.
How to Buy Shiba Inu
Picking up SHIB isn't complicated. Binance, Bybit, OKX, Upbit, and Gate all list it, and the process is basically the same everywhere: deposit funds, find the SHIB/USDT pair, and place a market or limit order.
New to this? Start small. Volatility like SHIB's punishes oversized positions fast.
And once you're holding a meaningful amount, move it off the exchange into a hardware wallet or a wallet you actually control.
Glossary
Descending Channel: Picture two parallel lines, both sloping down, one connecting the lower highs, the other the lower lows. Price bounces between them until it doesn't.
Symmetrical Triangle: Two trendlines squeezing the price from both sides, one rising, one falling. The tighter it gets, the bigger the eventual move tends to be.
Liquidation Heatmap: Basically a map of pain. It shows where leveraged longs and shorts get forcibly closed out as price swings through certain levels.
Support Zone / Resistance Level: The price areas where buyers or sellers have shown up before in enough size to stall or reverse a move. History doesn't always repeat, but these zones tend to matter again.
BTC Dominance: How much of the total crypto market Bitcoin alone accounts for. Traders watch it to gauge whether altcoins are in favor or getting ignored.
Methodology: price levels sourced directly from 1D and 1H TradingView charts; liquidation and volume data sourced from Coinglass; no data extrapolated beyond visible chart structure.
Disclaimer: This article is for informational purposes only and does not constitute financial advice. Cryptocurrency markets, including $SHIB, are highly volatile and speculative. Price levels discussed are derived from technical chart analysis of TradingView data as of August 4, 2026, and are probability-based scenarios, not guarantees. Always conduct independent research and consult a licensed financial advisor before making investment decisions.


















