Cardano price forecast: Will $ADA Break Out or Break Down Soon?


If you're looking for a Cardano price forecast this week, you'll notice the same thing on almost every chart out there:
$ADA is sitting right at a decision point. Both the 4-hour and daily charts show clean patterns, but they're pointing in opposite directions depending on which way price moves next.
Right now $ADA is currently trading at $0.1625, down about 1.1% over the last day. It's not crashing, but it's not showing a clear trend either.
Where ADA Stands Right Now
$ADA is currently trading at $0.1625, and over the past 24 hours it has moved between $0.1605 and $0.1683.
Market cap is at $6.072 billion, with a fully diluted value of $7.318 billion, and trading volume in the last day came in at $274.18 million. 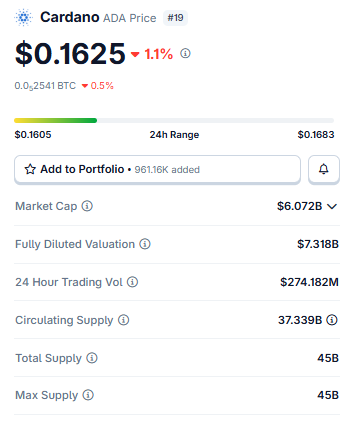
Source: Cardano Market Cap Data Taken From Coingecko, data as of July 30, 2026. Figures may vary slightly across other tracking websites.
Circulating supply stands at 37.339 billion ADA, out of a fixed max supply of 45 billion.
That fixed cap is worth keeping in mind for any longer-term Cardano price forecast, since ADA's total supply is already known and won't change like it does with inflationary coins.
Cardano Volume Heatmap Data
Most of the trading volume is happening on Binance, which handled $139.94 million, way more than Bybit's $47.96 million and OKX's $44.32 million. 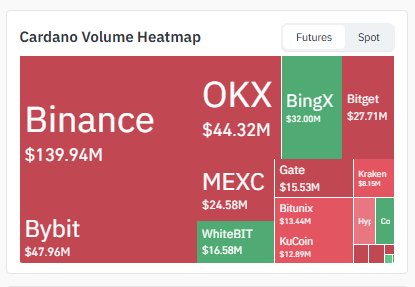
Source: Volume Heatmap Data Taken From Coinglass
Smaller exchanges like BingX, Bitget, MEXC, and Kraken make up the rest. Since so much volume sits on one exchange, a big move there can drag the rest of the market along pretty fast.
Liquidations and Whale Pressure
Leveraged traders are already feeling this squeeze. In the last 24 hours, $421.82K worth of ADA positions got liquidated, and longs took the bigger hit at $245.23K compared to $176.59K in shorts.
The 12-hour window shows the same pattern: $174.89K in long liquidations against just $83.14K in shorts. 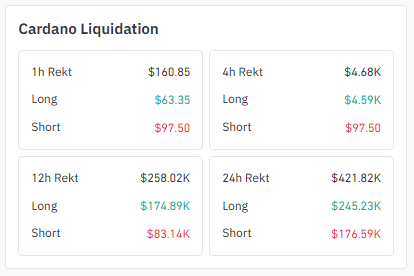
Source: Liquidation Data Taken From Coinglass.
That suggests traders who bought the recent bounce are getting shaken out while the price just chops around instead of trending.
This kind of imbalance is worth watching if you're building a Cardano price prediction forecast around short-term momentum.
A cluster of long liquidations near the current price sometimes clears the way for a sharper move once those weak positions are gone.
4H Chart: Stuck in a Falling Channel
On the 4-hour chart, ADA has been sliding down inside a descending channel for a while. 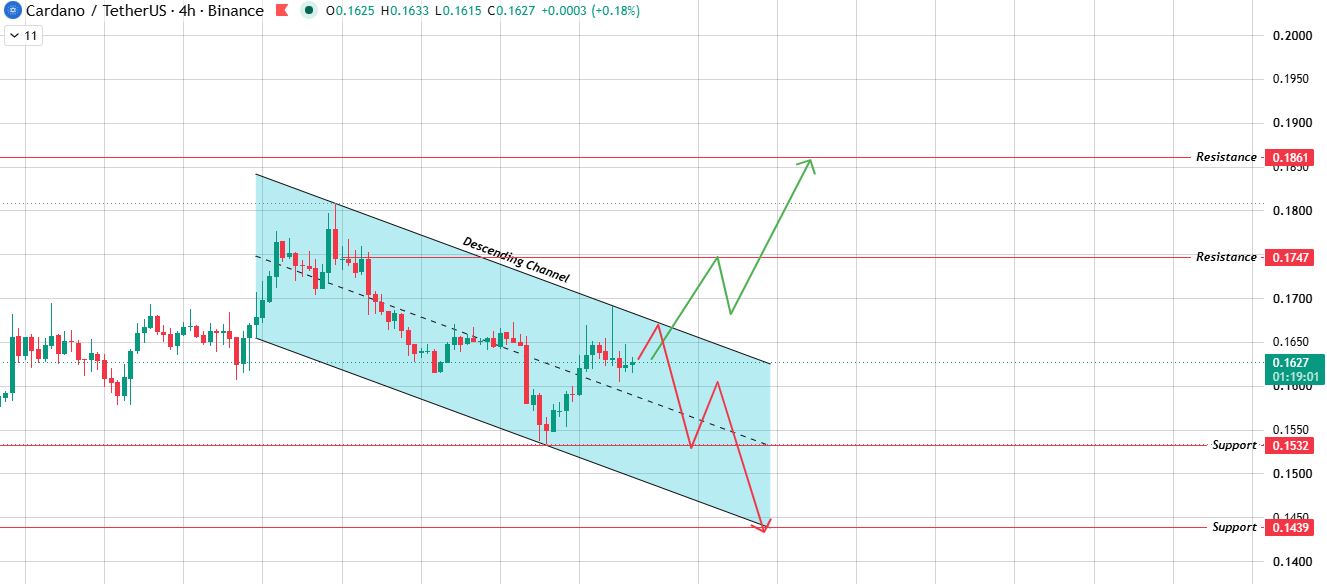
Source: Chart Taken From TradingView
The price is now pushing right against the top of that channel, and this is usually where traders start watching closely: either the price gets rejected and goes back down or it actually breaks out.
-
If ADA closes above the channel with decent volume, the first level to watch is $0.1747, and if buyers keep going, $0.1861 comes next.
-
If the channel holds and sellers take back control, support is at $0.1532, and a deeper drop could send the price down to $0.1439.
This channel test is really the short-term piece of any Cardano price prediction forecast right now.
It's the difference between a quick bounce and the recent slide just continuing.
1D Chart: A Triangle at the Same Spot
The daily chart adds another piece to this. $ADA has been coiling inside a symmetrical triangle for weeks. The latest daily candle, open 0.1621, high 0.1648, low 0.1615, close 0.1628, up 0.43%, is sitting almost exactly at the tip of that triangle. 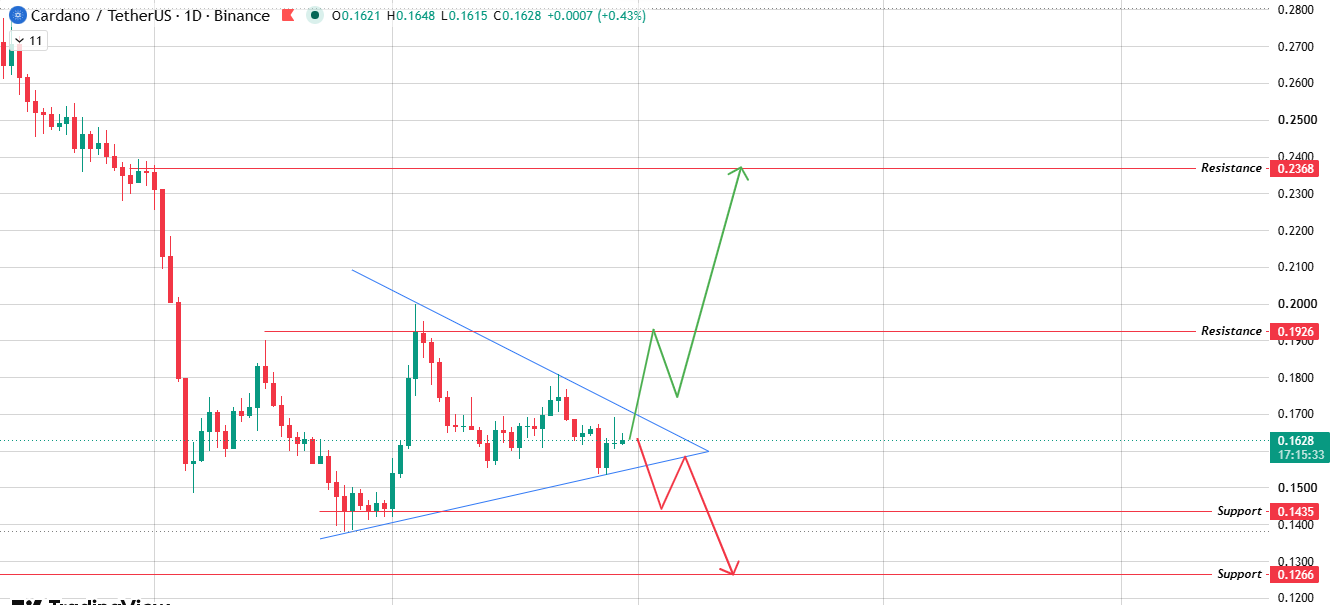
Source: Daily Chart Taken From TradingView
It's rare to see both the 4H and daily charts line up at a decision point at nearly the same price, but that's what's happening here.
-
A daily breakout above the triangle would probably test $0.1926 first, with $0.2368 as a longer target if the move keeps momentum.
-
A daily breakdown points toward $0.1435 first and possibly $0.1266 if that support gives way too.
Since both timeframes are lining up together, whichever way it breaks could matter more than usual. That's really why this Cardano price prediction forecast depends so much on the next couple of daily closes rather than any single signal.
The Network Itself Is Quietly Doing Fine
While the charts are stuck in indecision, Cardano's actual network keeps chugging along.
It recently crossed over 122.7 million total transactions on mainnet, and its eUTxO setup lets one single transaction send funds to multiple people and run several smart contract actions at the same time, a real advantage over simpler blockchain designs. 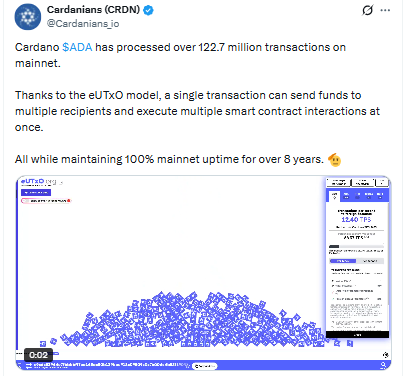
Source: Data Taken From @cardanians_io, X Account.
On top of that, Cardano has kept 100% mainnet uptime for more than eight years, which very few other networks can claim.
None of this changes price in the next 24 hours, but it's exactly the kind of thing that matters more the further out you look.
When short-term charts are this messy, steady network usage and reliability are usually what long-term holders lean on.
The Bottom Line
Right now, $ADA is genuinely stuck between a 4H channel breakout and a daily triangle resolution, and both are lining up near the same price.
A confirmed move above $0.1747 on rising volume opens the door to $0.1861 and eventually $0.1926.
A breakdown below $0.1532 risks a slide to $0.1439 and then the deeper daily support at $0.1266. Either way, the next few candles should make things a lot clearer.
Disclaimer: This article is for informational purposes only and does not constitute financial advice. Cryptocurrency markets are highly volatile, and price predictions are speculative by nature. Always do your own research and consult a licensed financial advisor before making investment decisions.









.jpg)








