Bitcoin Price Prediction: $70K Wall Looms After BTC ETF Inflows


Bitcoin price prediction charts are flashing a key warning this week. BTC is trading near $65,530, up from recent lows, but a wall of resistance sits just above.
After seven straight days of spot BTC ETF inflows, buyers have pushed the price higher. But chart watchers say the next few hundred dollars could decide where Bitcoin goes next.
What is the current Bitcoin price today?
Bitcoin is changing hands around $65,530.4, down slightly by 0.73% on the day. Open interest across futures markets sits at $48.78 billion, while spot volume over 24 hours is $3.15 billion.
Total futures volume has dropped 17.83% to $41.61 billion. Options open interest, though, climbed 2.95% to $34.52 billion, showing traders are still positioning for bigger moves.
Why are BTC ETF inflows important right now?
Spot BTC ETFs have logged seven straight trading days of inflows since July 14. According to Santiment Intelligence, roughly $981.2 million has flowed back into these funds during that stretch.
SoSoValue data backs this up. On July 22, ETFs saw $68.99 million in daily net inflow. Cumulative total net inflow now stands at $51.85 billion, with total net assets at $80.36 billion.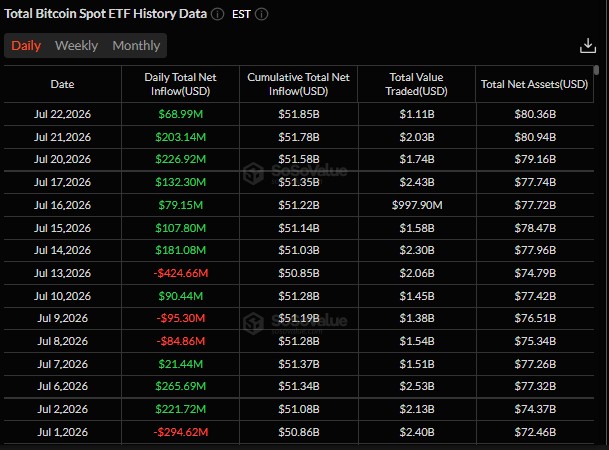
The last time inflows ran this long was back in October 2025, right as Bitcoin pushed toward its $126,000 all-time high. That does not guarantee a repeat, but it shows steady ETF demand can build momentum.
Date | Daily Net Inflow | Cumulative Inflow | Total Net Assets |
Jul 22, 2026 | $68.99M | $51.85B | $80.36B |
Jul 21, 2026 | $203.14M | $51.78B | $80.94B |
Jul 20, 2026 | $226.92M | $51.58B | $79.16B |
Jul 17, 2026 | $132.30M | $51.35B | $77.74B |
Jul 16, 2026 | $79.15M | $51.22B | $77.72B |
Jul 15, 2026 | $107.80M | $51.14B | $78.47B |
Jul 14, 2026 | $181.08M | $51.03B | $77.96B |
Before this run, ETFs went through a rough patch. On July 13, outflows hit -$424.66 million. Smaller outflows also showed up on July 10, July 9, and July 8.
What is the key resistance level for Bitcoin?
Analyst Ali Charts points to the MVRV Pricing Bands as the map to watch. The immediate resistance sits at $70,920, marked as the -0.5 Band.
This level matters because it lines up with the aggregate cost basis of many investors. That means a lot of holders bought near this price, and they may sell once they're back in profit.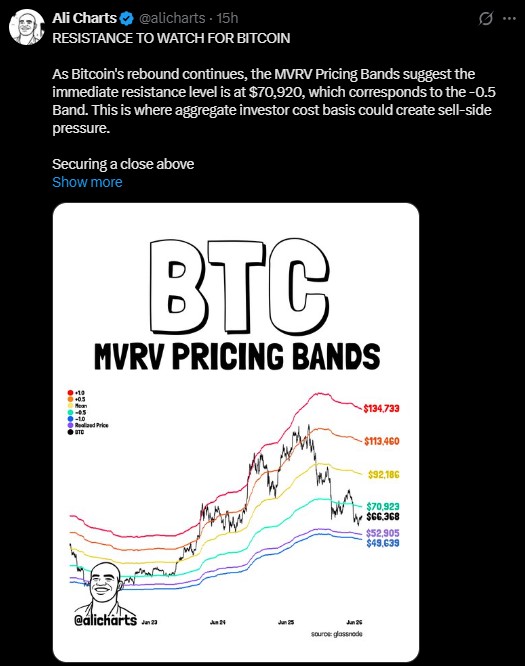
The full band structure looks like this:
Band | Price Level |
+1.0 Band | $134,733 |
+0.5 Band | $113,460 |
Mean | $92,186 |
-0.5 Band | $70,923 |
Realized Price | $66,368 |
-1.0 Band | $52,905 |
BTC (reference) | $49,639 |
A close above $70,920 would be needed to clear this overhead supply. Without that, the rebound could stall.
Could Bitcoin reject at $71,300 to $74,200?
Trader Crypto Patel is watching a different zone. He flags the $71,300 to $74,200 range as home to a major bearish order block and fair value gap.
This is where Patel says price rejections have happened before, based on liquidity sweeps to the downside seen earlier in the chart pattern. He is not planning to buy at the top of this rally.
His roadmap breaks down into three simple outcomes.
Rally into $71,300 to $74,200 stay patient and wait
Rejection confirmed from that zone prepare for downside
Drop into $50,000 to $40,000 start scaling into long-term buys
Patel's invalidation line is clear. A strong daily close above $74,300 would flip his whole thesis, and he says he would update his view publicly if that happens.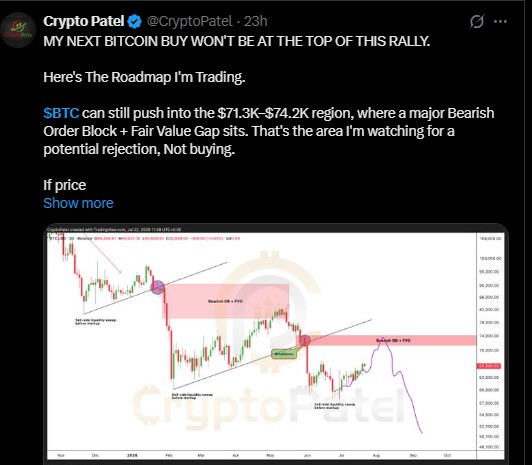
What happens if Bitcoin fails to hold $70K?
If sellers step in near the resistance zones outlined above, Bitcoin could slide back toward the $50,000 to $40,000 region, according to Patel's roadmap.
That kind of pullback would not be unusual after a multi-week rebound. Markets often retest lower levels before making a real run higher.
On the other hand, steady ETF inflows suggest some investors are not waiting around. If demand keeps climbing while price consolidates, that could help absorb selling pressure near $70,920.
Bottom line for traders watching BTC
Right now, Bitcoin sits in a wait-and-watch zone. The $70,920 level from MVRV bands and the $71,300 to $74,200 order block both point to the same idea. This area is heavy with potential sellers.
A confirmed close above $74,300 would change the picture completely. Until then, many traders appear to be treating this as a test, not a breakout.
Disclaimer
This article is for informational purposes only and does not constitute financial, investment, or trading advice. Cryptocurrency markets are highly volatile and carry significant risk of loss. Prices mentioned are based on data available at the time of writing and can change rapidly. Always do your own research and consult a licensed financial advisor before making any investment decisions.
Also read:

















