Bitcoin Cash Price Prediction: This BCH Level Could Change Everything


BITCOIN CASH PRICE PREDICTION is back in focus as $BCH slides toward a spot that has not been tested in a while, and the reaction here could set the tone for the next several sessions.
Our earlier Bitcoin Cash price prediction flagged a similar setup forming, and this next move looks like the one that finally answers the question.
Bitcoin Cash Price Right Now
| Metric | Value |
| Price | $216.18 |
| 24h Change | -2.07% (-$4.5723) |
| Market Cap | $4.34B |
| Futures Volume (24h) | $150.64M |
| Spot Volume (24h) | $8.21M |
| Open Interest | $308.42M |
| Circulating Supply | 20.06M BCH |
| Total Supply | 20.06M BCH |
| Max Supply | 21.00M BCH |
Source: Bitcoin Cash data on CoinGlass, as of July 23, 2026. Figures may vary slightly across other tracking websites.
Methodology And Data Sources
This Bitcoin Cash price prediction pulls live price, volume, and open interest figures from CoinGlass, with liquidation flow sourced from CoinGlass's dedicated $BCH liquidation tracker.
Chart structure comes directly off the 1-hour BCH/USDT chart on Binance via TradingView.
Every level referenced below is treated as invalidated only on a confirmed candle close beyond that level, not on a brief intraday wick through it.
Bitcoin Cash Liquidation Data Today
Liquidation flow over the past day is almost entirely one-sided so far. Over the past hour, $1.44K was liquidated, and every bit of it came from longs, with nothing lost on the short side.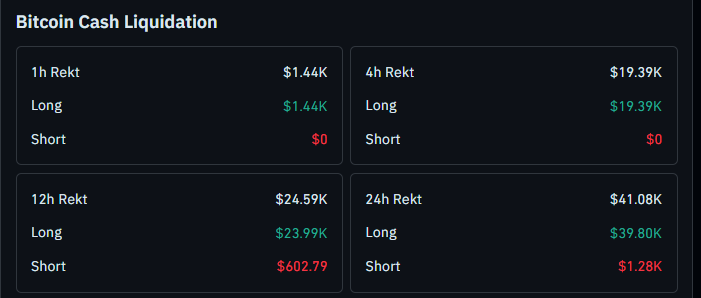
The 4-hour window shows the same pattern, with $19.39K wiped out, again entirely from long positions.
Stretch that to 12 hours and total liquidations reach $24.59K, made up of $23.99K in longs and just $602.79 in shorts.
Across the full 24 hours, liquidations climb to $41.08K, with $39.80K coming from longs and $1.28K from shorts. The heavy skew toward long liquidations across every timeframe shows leveraged buyers have been caught repeatedly on this slide lower, which is worth keeping in mind heading into the next support test.
Full data is available through the Bitcoin Cash liquidation tracker.
Bitcoin Cash Price Prediction: 1-Hour Chart Analysis
Methodology note: This reading uses the 1-hour BCH/USDT chart on Binance via TradingView, combining price structure with a fair value gap for added confirmation.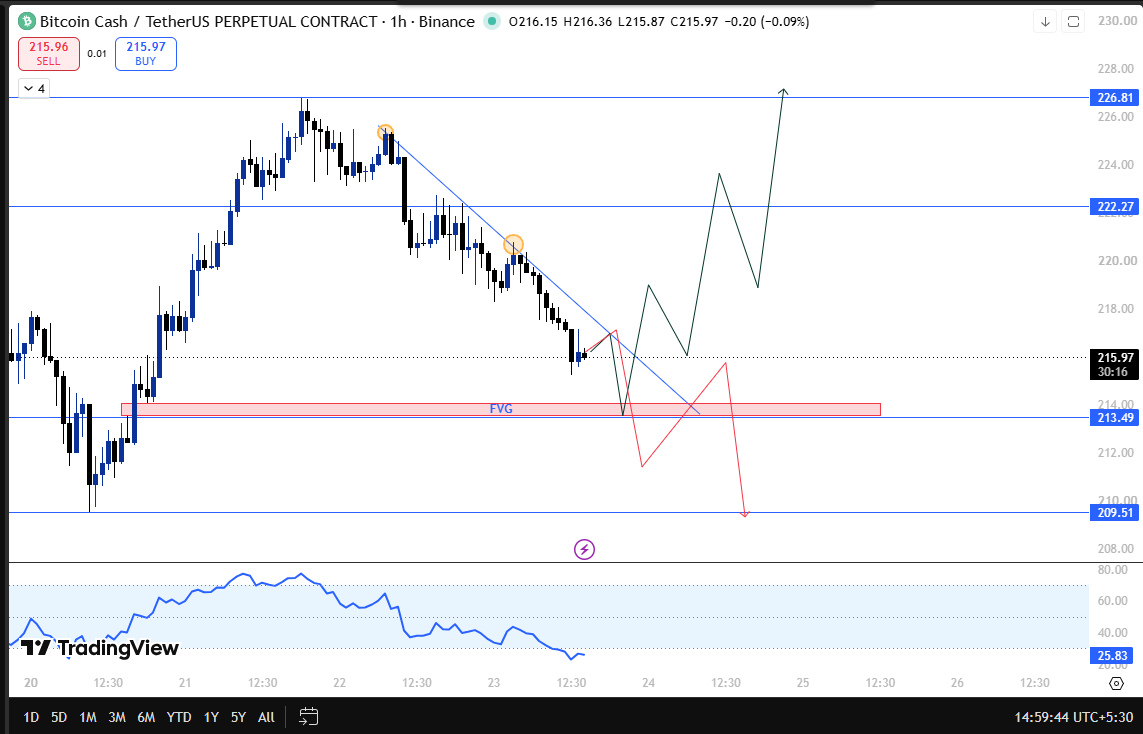
Levels are only considered invalidated on a confirmed candle close beyond the stated trigger, not an intraday wick.
On the 1-hour chart, $BCH has been sliding lower along a descending trendline, but the pace of that slide has been slow and gradual rather than sharp, which often signals sellers are losing some of their earlier momentum.
Price is now approaching a support zone, and just below that zone sits a fair value gap on the same 1-hour timeframe, an area where price previously moved through quickly without much trading activity and often gets revisited before a real decision is made.
This kind of setup lines up with what we outlined in our earlier BCH support breaks analysis, where a similar slow grind lower eventually met real buying interest.
If $BCH holds this support and the fair value gap beneath it, the next resistance levels to watch sit at $222.27 and then $226.81 further out.
On the other hand, if price breaks below $213.49 and closes there, that would confirm the support has failed, and the setup shifts toward $209.51 as the next level in view.
Any close below $213.49 is treated as the clean invalidation point for this bullish read.
Bitcoin Cash Technical Snapshot
| Indicator | Signal |
| Trend | Slow descending trendline, approaching support |
| Structure | 1H fair value gap sitting just below current support |
| Liquidations | Longs absorbing nearly all damage across every window |
Bitcoin Cash Support And Resistance Levels To Watch
| Type | Level | Note |
| Resistance 2 | $226.81 | Extended upside target |
| Resistance 1 | $222.27 | Primary resistance |
| Current Price | $216.18 | Approaching key hourly support |
| Support / FVG Zone | $213.60-$214.06 | 1H fair value gap sits just below |
| Invalidation | $213.49 | A confirmed close below breaks the setup |
| Next Downside Target | $209.51 | Level in view if support fails |
This lines up closely with the zone flagged in our BCH recovery scenario piece, where a similar support hold led to a move back toward resistance.
Risk-Reward Table
| Case | Trigger | Target |
| Bull Case | Support and fair value gap hold $213.60-$214.06 | Move toward $222.27 and then $226.81 |
| Bear Case | Breaks and closes below $213.49 | Slide toward $209.51 |
Invalidation Level
This bullish read on BCH depends on price holding above $213.49 on a closing basis.
A confirmed 1-hour close below that level breaks the setup entirely and opens the path toward $209.51.
For a broader read on how this ties into the wider BCH trend, see our BCH price prediction today coverage.
Historical Context
BCH has shown this kind of slow, grinding pullback before, and it has not always ended in a breakdown.
In our earlier BCH breakout or rejection call, a similar controlled slide met buyers at a key hourly zone and reversed from there.
What makes the current move worth watching is the fair value gap sitting directly beneath the support, which adds a second layer of confirmation to the level rather than leaving it as a single line on the chart.
Bitcoin Cash Glossary
Descending Trendline: A falling line connecting a series of lower highs, used to track the pace and structure of a downtrend.
Fair Value Gap (FVG): A price zone where an asset moved quickly in one direction without much trading activity, often revisited later before price makes its next real move.
Liquidation: What happens when a leveraged trade gets forcibly closed because the trader ran out of margin to keep it open.
Open Interest: The total value of derivative positions like futures that remain open and have not been settled.
Expert View
BCH sliding into this support zone at a slow, controlled pace rather than a sharp drop is worth paying attention to, especially with a fair value gap sitting right underneath it on the same timeframe.
That combination gives buyers two separate reasons to step in around the same area, similar to the setup covered in our BCH dollar 1000 milestone piece, where a comparable zone held before a stronger move followed.
The heavy long liquidations over the past 24 hours also suggest a good share of over-leveraged buyers have already been flushed out, which can sometimes clear the path for a cleaner bounce.
As long as $213.49 holds on a closing basis, the bias stays tilted toward $222.27 and then $226.81.
A confirmed close below $213.49 would be the clearest sign that sellers have taken control, with $209.51 becoming the next level in play.
Disclaimer: This article is for informational purposes only and should not be considered financial advice. Cryptocurrency markets are highly volatile, and price predictions are not guaranteed. Please do your own research before making any investment decisions.

















