Chainlink Price Prediction: The LINK Rally Nobody Is Expecting


Chainlink has been around since 2017, one of the older, more established names in crypto.
It built its reputation on oracle networks, the plumbing that lets blockchains pull in real-world data: prices, weather, sports outcomes, that sort of thing.
That infrastructure role is a big reason it's stuck around through multiple market cycles while plenty of newer tokens faded out.
As for where things stand today, LINK is trading around $8.19, comfortably inside its recent weekly range with nothing dramatic happening in either direction.
What follows is a Chainlink price prediction built around recent market behavior, kept free of unnecessary jargon.
Live Market Data
As of August 6, 2026, CoinGecko has $LINK priced at $8.19, having moved between $8.07 and $8.24 over the past day. 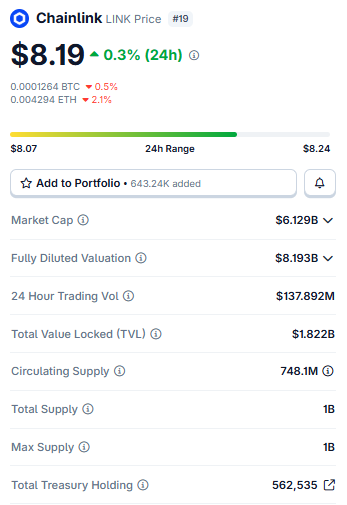
Source: $LINK Market Cap Data Taken From Coingecko, data as of Aug 06, 2026. Figures may vary slightly across other tracking websites.
Market cap comes in at $6.129B, while fully diluted valuation (FDV) sits higher at $8.193B.
24-hour trading volume is $137.892M, and Total Value Locked (TVL) across Chainlink's oracle infrastructure stands at $1.822B.
Circulating supply is 748.1M $LINK against a 1B max supply, and on-chain tracking puts the project treasury at 562,535 LINK.
Liquidation Data of Chainlink
Coinglass figures point to a relatively quiet session on the liquidation front. The past hour saw just $30.15 wiped out, all of it on short positions. 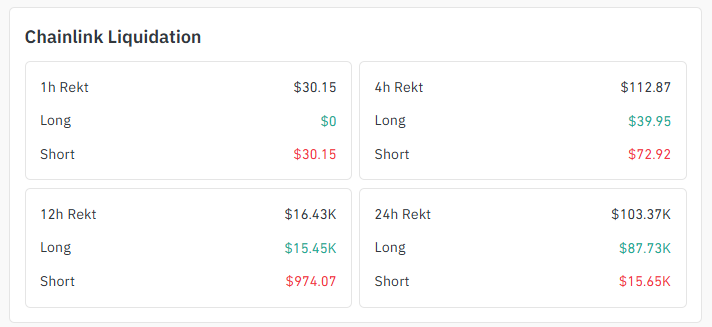
Source: Liquidation Data Taken From Coinglass .
Widen that to four hours and the total climbs to $112.87, split between $39.95 in longs and $72.92 in shorts. The 12-hour window tells a different story: $16.43K liquidated, with longs accounting for the bulk at $15.45K.
Over the full 24 hours, total liquidations reached $103.37K, longs again dominating at $87.73K against $15.65K in shorts.
That long, heavy skew across the fuller window suggests leveraged buyers absorbed some pressure while price consolidated beneath the triangle's upper trendline.
Still, the absolute figures here are small relative to LINK's overall market capitalization, so this data shouldn't be read as a decisive signal on its own.
Exchange Volume
Add up futures turnover across major exchanges via Coinglass, and the total comes to roughly $206.8M.
Binance leads by a wide margin at $71.33M, with MEXC and Bybit trailing at $28.19M and $24.09M respectively.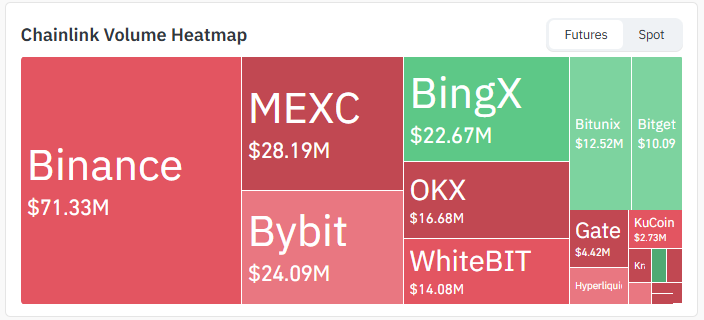
Source: Volume Heatmap Data Taken From Coinglass.
The remainder is spread across BingX, OKX, WhiteBIT, Bitunix, Bitget, Gate, and KuCoin, none individually significant.
Worth noting: this futures-specific number doesn't match the $137.892M 24-hour trading volume CoinGecko reports, and that's expected rather than a red flag.
CoinGecko blends spot and derivatives activity using its own aggregation approach, so the two figures measure genuinely different things rather than disagreeing on the same one.
Institutional and On-Chain Context
This week, Grayscale published commentary positioning Chainlink as core infrastructure for bringing real-world financial data onto blockchain networks, everything from equity prices to interest rates to foreign exchange rates. 
Source: Data Taken From @Grayscale, X Account.
The firm's Head of Research, Zach Pandl, tied that thesis directly to the Grayscale Chainlink Trust ETF (GLNK), a product offering LINK exposure without the hassle of direct custody.
It's worth being clear about what this is: a company statement linked to a specific investment product, not independent research, and it should be weighed with that in mind rather than treated as neutral commentary.
Separately, on-chain figures show Chainlink's treasury holding 562,535 LINK, while the protocol secures $1.822B in TVL across integrated platforms.
Neither number moves price today, but both speak to the network's longer-term adoption footprint.
Technical Analysis
4-Hour Chart Analysis of Chainlink
Zooming in the 4H chart (LINKUSDT, Binance), where LINK is shaping what's known as a descending triangle. Each rally has printed a lower high, while a flat support band near $8.00 to $8.05 has held firm underneath. 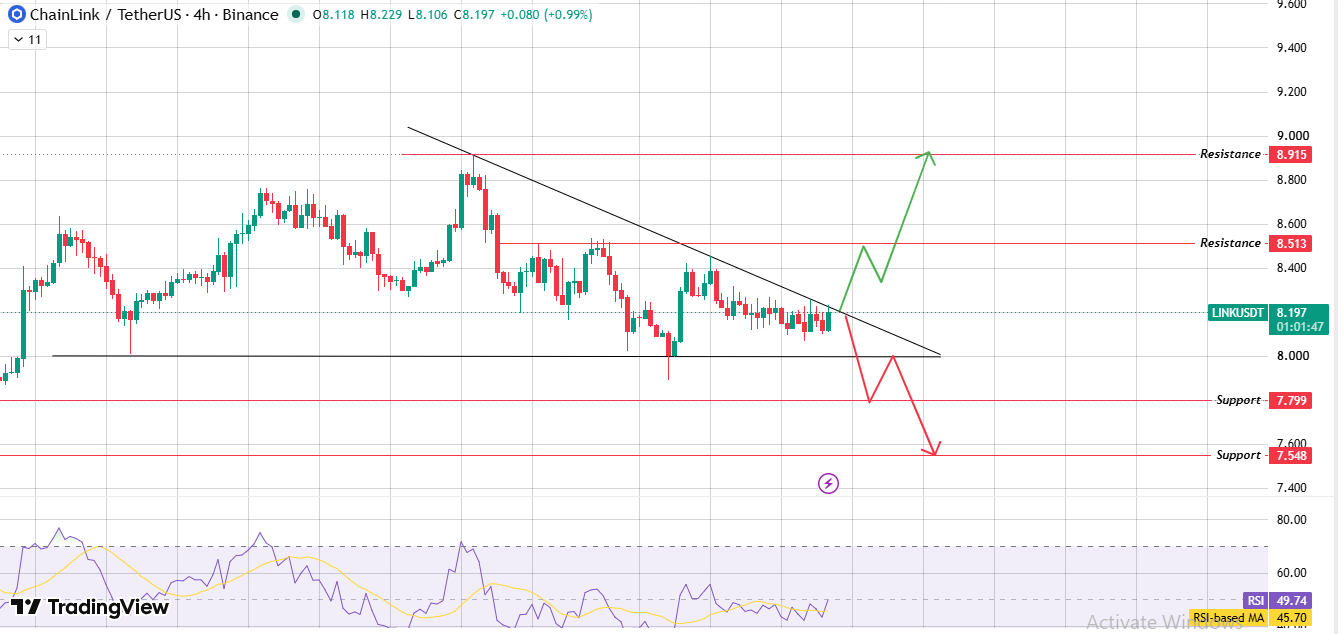
Source: Chart Taken From TradingView.
That combination usually signals fading conviction from buyers at the top, even as sellers haven't managed to force the floor yet.
Should price clear the descending trendline near $8.40, the immediate implication is a run toward $8.513, with $8.915 as the extended target if volume follows through.
The alternative reading is less forgiving: a confirmed break of $7.799 support would point toward $7.548 next.
RSI currently sits at 49.74, just above its 45.70 moving average, a reading that leans neither bullish nor bearish in any meaningful way.
Daily Chart Analysis of $LINK
Widen the lens to the daily timeframe, and a different structure emerges.
$LINK has been climbing inside an ascending channel since its most recent low, and that broader trend gives the shorter-term triangle some context. 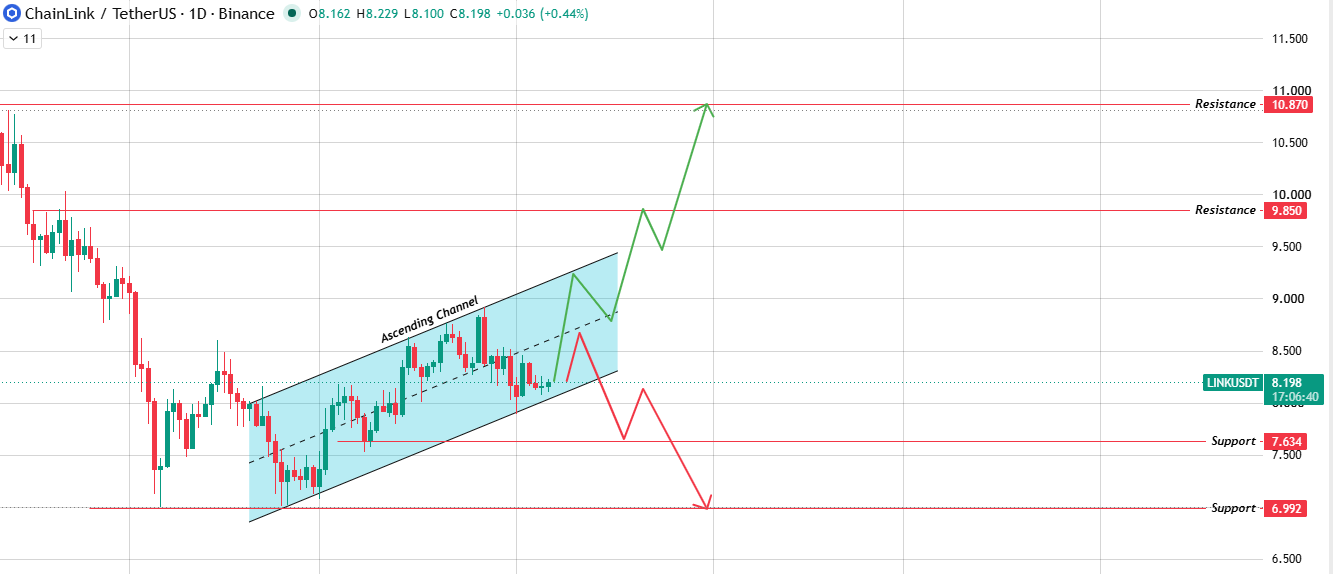
Source: Chart Taken From TradingView.
Resistance on this chart sits at $9.850, and clearing it with volume would put $10.870 within range.
On the downside, $7.634 marks the first support, with $6.992 sitting as a deeper backstop should the channel structure give way entirely.
As long as the price holds above the channel floor, the longer-term picture stays constructive regardless of how the 4H pattern resolves in the near term.
Chainlink Price Prediction: Bull, Base, and Bear Scenarios
What would break the bull case? Either a rejection at $8.513 without volume stepping up or the 4H trendline resistance near $8.40 holding through two straight candle closes.
The bear case falls apart differently. If buyers show up and defend $7.799 on a retest, that's a sign this triangle was a pause in the uptrend, not the start of a reversal.
Risks and Invalidation Conditions
A few things could throw off this Chainlink price prediction.
The descending triangle on the 4H chart hasn't resolved yet, so what's described here is a directional lean, not a confirmed outcome.
Then there's BTC dominance, Bitcoin's share of total crypto market capitalization, which tends to weigh on altcoins like $LINK when it climbs, regardless of anything happening on LINK's own chart.
And the liquidation data covered above is thin in absolute terms today, which means this setup hasn't really been tested by meaningful leveraged positioning in either direction yet.
Glossary
Descending Triangle: Flat support on the bottom, a downward-sloping line of lower highs on top. The eventual break, not the slope, usually decides where price goes.
Ascending Channel: Two parallel trendlines climbing together, with price bouncing between them as it works its way higher.
Support Zone: A price area where buying has historically shown up and slowed or reversed a decline.
Liquidation: What happens when a leveraged position gets force-closed because losses have eaten through the available margin.
BTC Dominance: Bitcoin's slice of the total crypto market cap, often used as a rough gauge of whether capital is rotating toward or away from altcoins.
Disclaimer: This article is for informational purposes only and does not constitute financial advice. Cryptocurrency markets are highly volatile. All price levels referenced are derived directly from TradingView chart data, and liquidation figures come from Coinglass. Always conduct independent research before making investment decisions.


















