Cartesi Price Prediction 2026: Can $CTSI Hold Above $0.037?


A coin that had been fading for months just ripped higher without warning, and traders are paying attention again. Small tokens go quiet, then erupt in one session. So which side of this move is real?
Cartesi Price Prediction Today: CTSI Price Prediction After Breakout
Cartesi price prediction searches are climbing fast, and this CTSI price prediction today update explains why. CTSI broke out of a multi-month range in hours, and the chart went from forgettable to front-page.
Here's the thing: a move this sharp rarely comes from nowhere. It never stays quiet once it starts.
CTSI still carries risk. A small cluster of wallets controls a huge slice of supply, and the coin remains far below its 2021 high.
But a breakout paired with forced short covering is the kind of setup that either fades in days or turns into a real CTSI rally prediction. Will Cartesi go up from here, or is this $CTSI price forecast after the rally just a fakeout?
For the setup before this move, see the CTSI rally breakout targets coverage rather than reading another Cartesi price outlook after the breakout that repeats the last one.
Key Takeaways
Direction: Momentum is bullish short-term, but this looks squeeze-driven, not demand-driven.
Price now: Around $0.0336, up 56% in 24 hours, per CoinMarketCap.
Support: $0.0203, then $0.0161. Resistance: $0.0376, then $0.0459.
Invalidation: A daily close under $0.0203 breaks the bullish $CTSI price forecast.
Data captured August 6, 2026, 07:15 UTC, from TradingView, CoinMarketCap, CoinGlass, and Etherscan.
For comparison, this timeframe framing mirrors how we set up the Bitcoin price prediction 2026 call, just on a much smaller cap.
Cartesi (CTSI) Coin Overview
Metric | Value |
Price | $0.0336 |
Market Cap | $31.33M |
FDV | $33.62M |
24H Volume | $25.27M |
Circulating Supply | 932.05M CTSI |
Max Supply | 1B CTSI |
All-Time High | $1.75 (May 9, 2021) |
All-Time Low | $0.02036 (Jul 30, 2026) |
CTSI trades across several venues, so check a crypto exchange listing tracker if you trade across more than one.
Daily Chart Analysis
On the daily chart, $CTSI broke a descending channel that had capped price since June, per the TradingView daily chart. 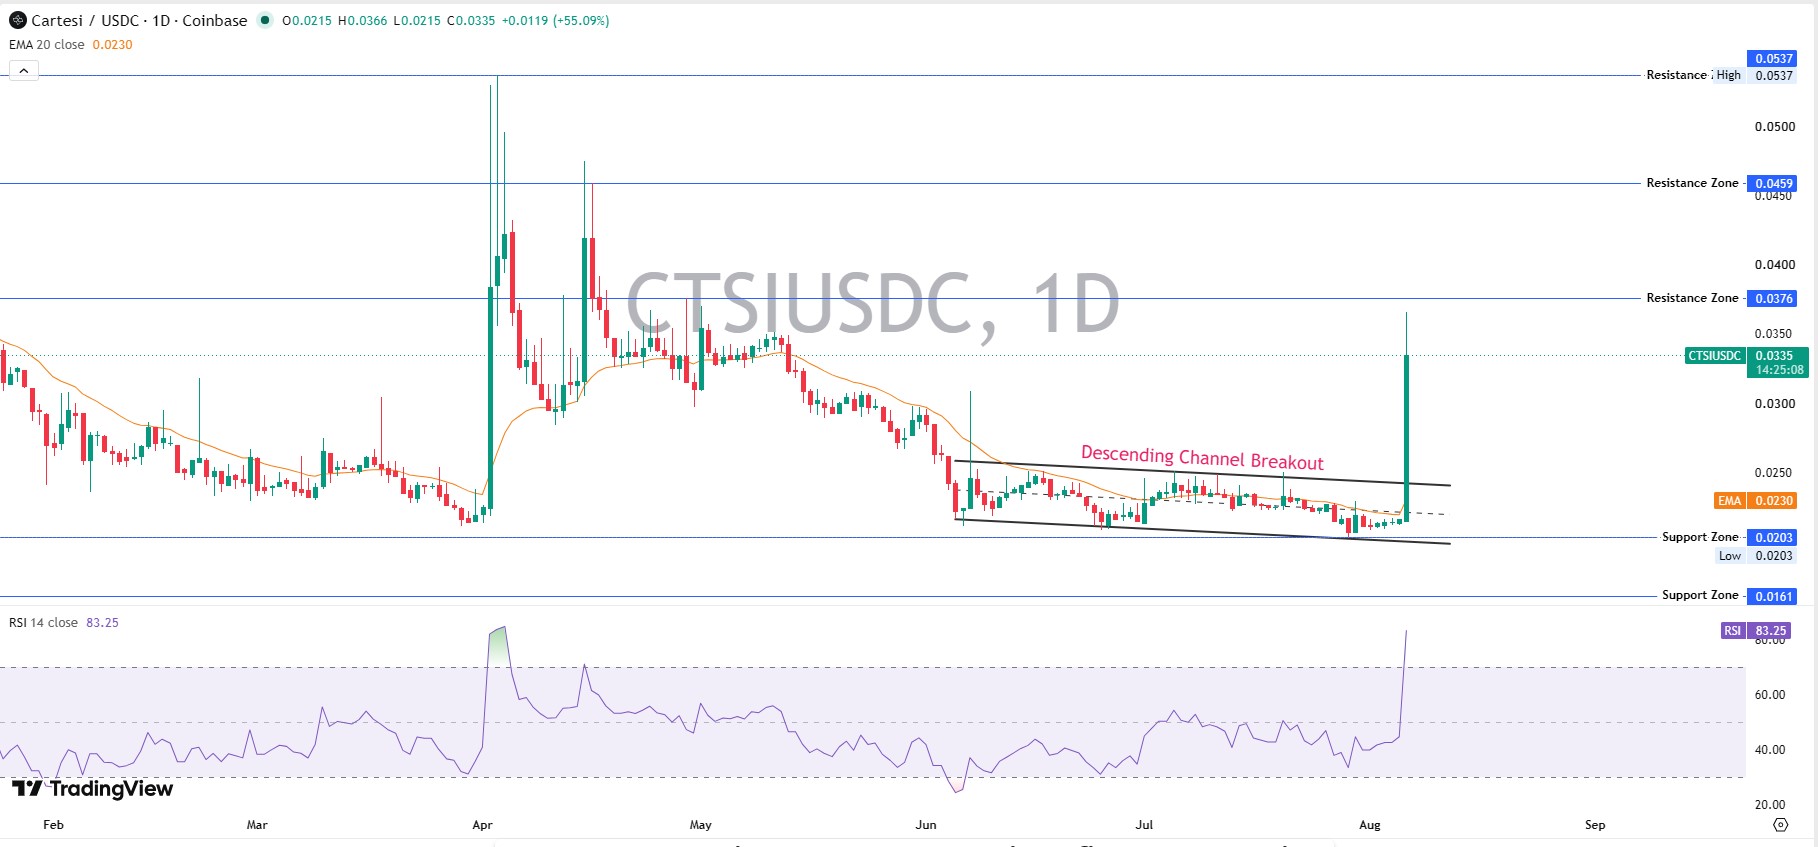
The session opened near $0.0215, ran to a high of $0.0366. RSI sits at 83.25, extremely overbought, so a cooldown is likely even inside an uptrend. The 20-period EMA sits near $0.0230, well below the current price, with resistance at $0.0376 and $0.0459 and support at $0.0203 and $0.0161.
Weekly Chart Analysis
Weekly RSI reads a calmer 54.92, nowhere near overbought even after a candle this large. 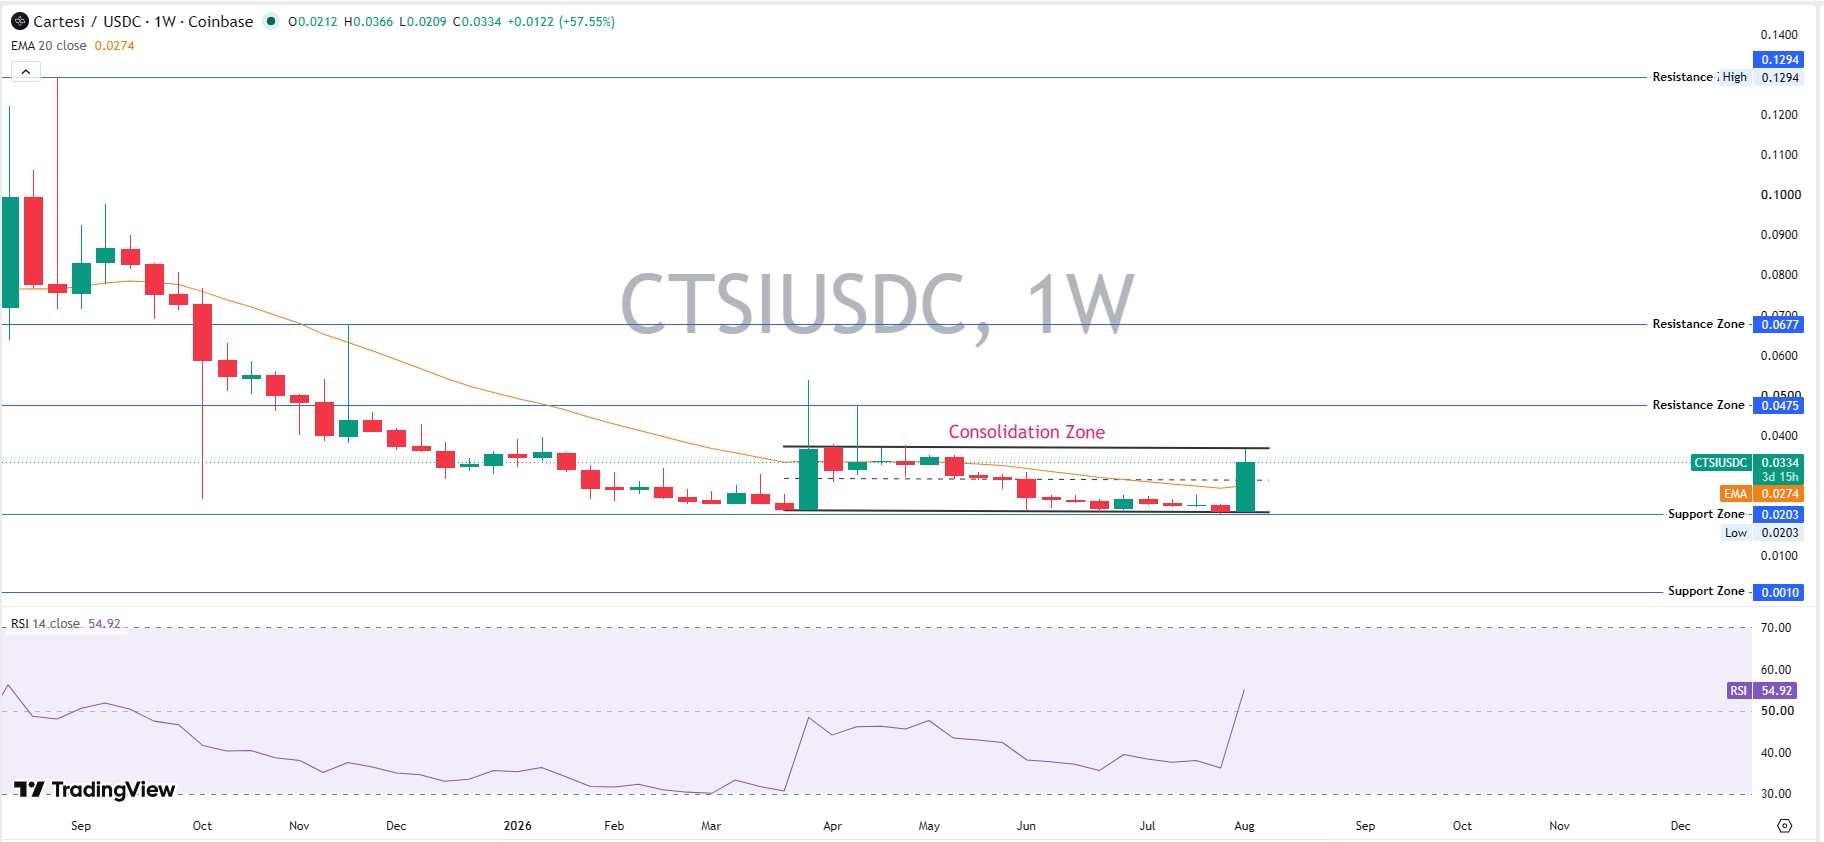
The weekly chart shows a consolidation zone held since spring, with resistance at $0.0475, then $0.0677, and a high near $0.1294. Weekly EMA20 sits at $0.0274, well below the current price. That gap between price and trend looks steeper than what shows up on the Ethereum price prediction 2026 charts right now, simply because $CTSI has thinner liquidity.
CTSI Price Prediction Next 7 Days and Next 30 Days
CTSI price outlook for the next 7 days: a weekly close above $0.0376 flips structure to bullish. Fail there, and the price likely ranges from $0.025 to $0.037 for this $CTSI price forecast this week.
CTSI price projection next 30 days: if volume holds, $CTSI tests $0.0459. If the squeeze fades, expect a drift back toward $0.020-$0.026.
It's worth a quick check of the coin events calendar too, in case anything scheduled lines up with this window.
Cartesi Price Target 2026-2027: Long-Term vs Short-Term
This Cartesi long-term price prediction leans on the compute and AI-linked demand narrative holding up. A $CTSI price target for 2026 sits near $0.068-$0.10 in the bull case, against a bear case revisiting $0.0161.
Cartesi sits inside a wider group of decentralized compute crypto coins chasing the same off-chain execution narrative right now.
Looking at the Cartesi price projection for 2026-2027, sustained adoption of Cartesi's Linux-based execution layer would need to show up in real usage, not just price, for any of these levels to hold. The $CTSI short-term price outlook stays far more volatile than this $CTSI future price forecast curve, and the $CTSI price after breakout action over the next few sessions will say more than any single target.
$CTSI Bullish Price Projection vs $CTSI Bearish Price Prediction: How High Can $CTSI Go?
Can $CTSI reach $0.10? Possible in a strong 2026 bull case, roughly 3x from here, but it needs sustained volume, not just one squeeze.
Can $CTSI reach $0.50? That needs about 15x from current price. Nothing in current volume or on-chain data supports that near-term.
Can $CTSI reach $1 in 2026? Unlikely. That is roughly 30x from here, and it would still sit below the 2021 high.
Will $CTSI reach its previous high of $1.75? Not on this rally alone. That would take a fundamentally different market cycle.
Whale Concentration and Risk
Holder data from the Etherscan token page shows the top 10 wallets hold 67.36% of supply, one unlabeled wallet alone holds 25.46%, and the Gini score sits at 0.9934.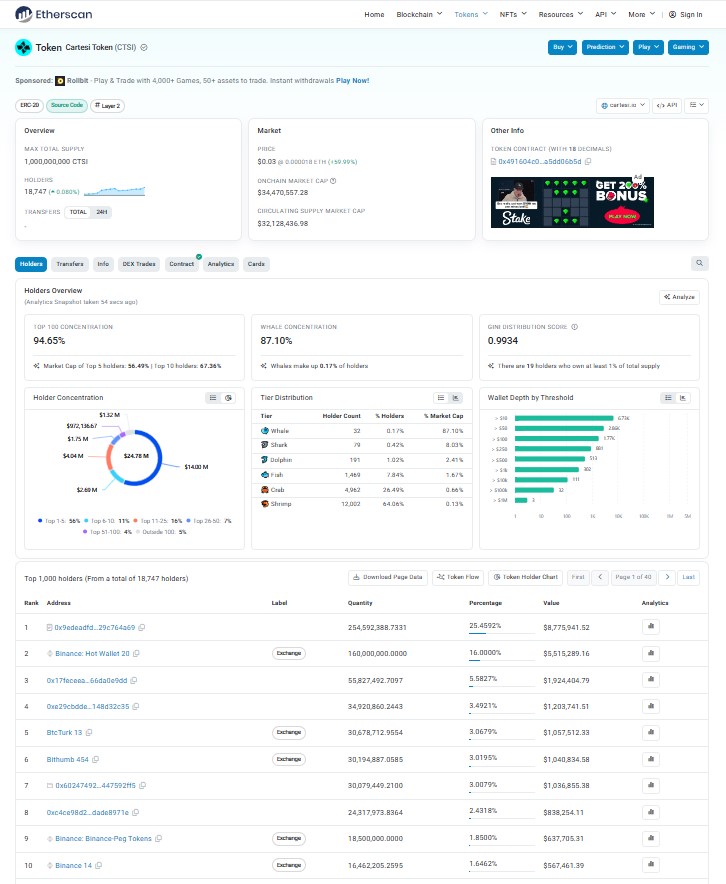
Exchange volume leans on Binance, at $12.94M of futures volume per the CoinGlass exchange heatmap.
The upcoming Fed rate decision could shake altcoin sentiment either way.
So could the Clarity Act vote, which tends to move the whole market, not just $CTSI.
Scenarios by Timeframe
Broader market mood matters here too, so it is worth scanning latest crypto market news alongside these levels.
Timeframe | Bull | Base | Bear |
24H | Above $0.0336 toward $0.0376 | $0.028-$0.031 | Fails, retests $0.0203 |
7D | Close above $0.0376 | $0.025-$0.037 | Breaks $0.0203 |
30D | Tests: $0.0459 | $0.020-$0.026 | Under $0.0161 |
2026 | $0.068-$0.10 | Rangebound $0.020-$0.048 | Revisits $0.0204 low |
Disclaimer: This is speculative market commentary, not investment advice. Crypto assets are volatile and can lose most or all of their value.


















