COTI Price Prediction 2026: Can the Privacy Rally Hold?


Something has clearly shifted for a token that most traders had stopped checking. A quiet privacy project just staged one of the sharpest weekly moves in the market, and that kind of jump always drags fresh eyes back in. Is this the start of something bigger or a leverage-fueled bounce that fades once the dust settles?
$COTI Price Prediction: Why a Sleepy Privacy Token Is Everywhere
This COTI price prediction matters right now because $COTI stopped being ignorable this week. It spent months drifting lower inside a tightening range, the kind of chart pattern that barely gets a second look.
Then the range broke.
Traders who had $COTI muted are asking the same question again: is this real demand, or is this leverage doing what leverage does? A proper $COTI forecast has to separate the two before it says anything useful about COTI's future price.
There's a privacy-narrative push behind it and a derivatives story sitting right on top of that. Ready to see what the charts and the wallets are really saying?
COTI Latest Update — July 30, 2026
Current price: $0.01699, down about 1.7% intraday
Weekly performance: up roughly 130% on the current weekly candle (still open, 3 days 21 hours left)
Main catalyst: COTI Foundation's privacy-portal push and "privacy on demand" narrative repost, paired with a short squeeze ($3.96M in short liquidations over 24 hours)
Main risk: extreme whale concentration — 53 wallets (0.18% of holders) control 80.52% of market cap, Gini score 0.9812
Market status: daily chart overbought (RSI 87.50) and extended above its Bollinger upper band; weekly chart healthier (RSI 55.00), sitting at its upper band rather than far above it
Key Takeaways
-
COTI price today sits near $0.01699, down about 1.7% intraday but up roughly 130% on the current weekly candle, which still has about 3 days 21 hours left before it closes.
-
Daily RSI sits at 87.50, deeply overbought; weekly RSI is a calmer 55.00, a gap that matters a lot for this COTI price prediction 2026.
-
The daily chart broke out of a falling wedge; the weekly chart broke out of a descending channel, both classic $COTI bullish breakout signals.
-
24-hour liquidations hit $6.11M, with $3.96M coming from shorts, a squeeze pattern. But in the most recent hour, longs took the bigger hit ($341.01K vs. $98.02K in shorts), an early cooling signal.
-
Whale concentration is severe: 53 wallets (just 0.18% of holders) control 80.52% of market cap, and the Gini score sits at 0.9812.
-
The likely catalyst is $COTI Foundation's privacy-portal push (privacy.coti.io) and a "privacy on demand" narrative repost, not a confirmed listing or partnership.
Table of Contents
-
Why $COTI Is Moving Today
-
COTI Technical Analysis: What the Charts Show
-
$COTI Support and Resistance Levels
-
Tokenomics And Whale Concentration
-
Where $COTI Is Actually Trading
-
COTI Price Prediction: Scenarios By Timeframe
-
Will $COTI Reach $1? Can It Reach $5?
-
$COTI Market Outlook: Risks To Watch
-
Glossary
-
Methodology
Why COTI Is Moving Today
Here's the thing: two separate stories are stacked on top of each other here.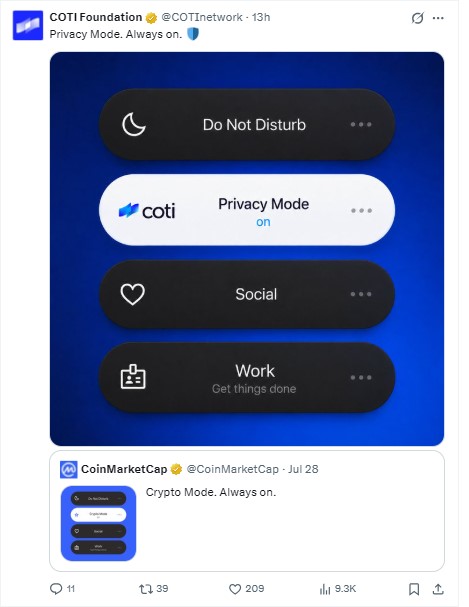
The first is narrative. The $COTI Foundation posted "Privacy Mode. Always on." this week, a riff on a CoinMarketCap post about "Crypto Mode," paired with a bigger push around its COTI Privacy Portal, which lets users send and receive encrypted-balance "p. tokens." A separate repost called $COTI is the "center axle" of a privacy wheel feeding tools to other L1s and L2s. That's a positioning story, not a confirmed partnership or listing.
The second story is mechanical. Over 24 hours, $COTI saw $6.11M in total liquidations, $3.96M of that from shorts getting forced out against $2.15M on the long side, per Coinglass liquidation tracking. That imbalance held through the 12-hour window too.
But the most recent hour flipped: $341.01K in longs got liquidated against just $98.02K in shorts.
The same leverage that pushed $COTI up is now starting to punish the people who chased it. Squeezes cut both ways.
Why COTI's Privacy Rally Matters
Privacy infrastructure is becoming a bigger theme across crypto markets, and COTI's move puts it back in that conversation. The open question traders are watching is whether this demand is spot-driven or leverage-driven — the liquidation data above suggests leverage is doing a lot of the work so far. On top of that, COTI's high wallet concentration remains a major structural risk that doesn't disappear just because price is green.
What Is COTI and Why Is Privacy Important?
COTI is a blockchain project focused on privacy-enabled infrastructure. Its ecosystem uses cryptographic technology designed to allow confidential transactions while maintaining blockchain usability. That's the backdrop for this week's rally: the COTI Foundation's push around its Privacy Portal and "privacy on demand" messaging is what reignited attention, even though it isn't a confirmed listing or partnership.
COTI Technical Analysis: What the Charts Show
This is the core of any real COTI technical analysis right now, and the daily and weekly timeframes are telling slightly different stories.
Daily Chart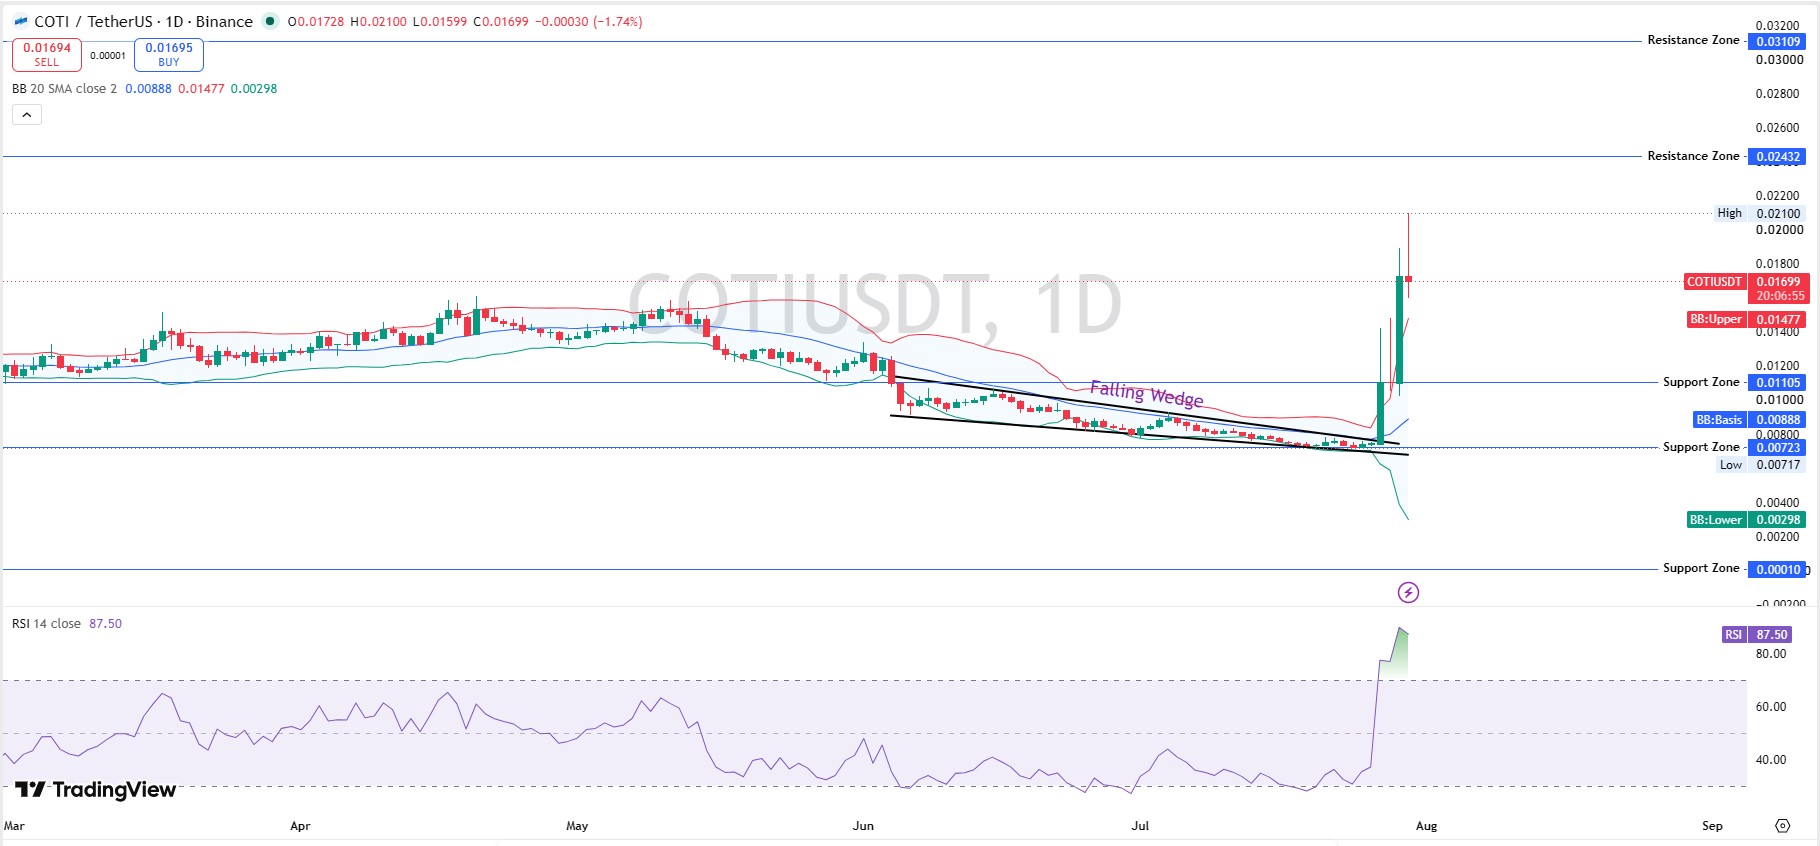
On the daily timeframe, $COTI broke out of a falling wedge that had been forming since June, a pattern that usually resolves upward, and this is the clearest $COTI breakout prediction signal on the chart right now. Price ran from around $0.01599 (today's low) to a high of $0.02100 before easing back to $0.01699, down 1.74% on the day. You can track this setup live on TradingView's COTI/USDT chart.
Daily RSI sits at 87.50. That's not just overbought; it's stretched about as far as the indicator goes without maxing out completely.
The daily Bollinger Bands (20 SMA, 2 close) show the basis at $0.00888, the upper band at $0.01477, and the lower band at $0.00298. The price is now trading well above its own upper band. That's extension, not a stable trend.
Weekly Chart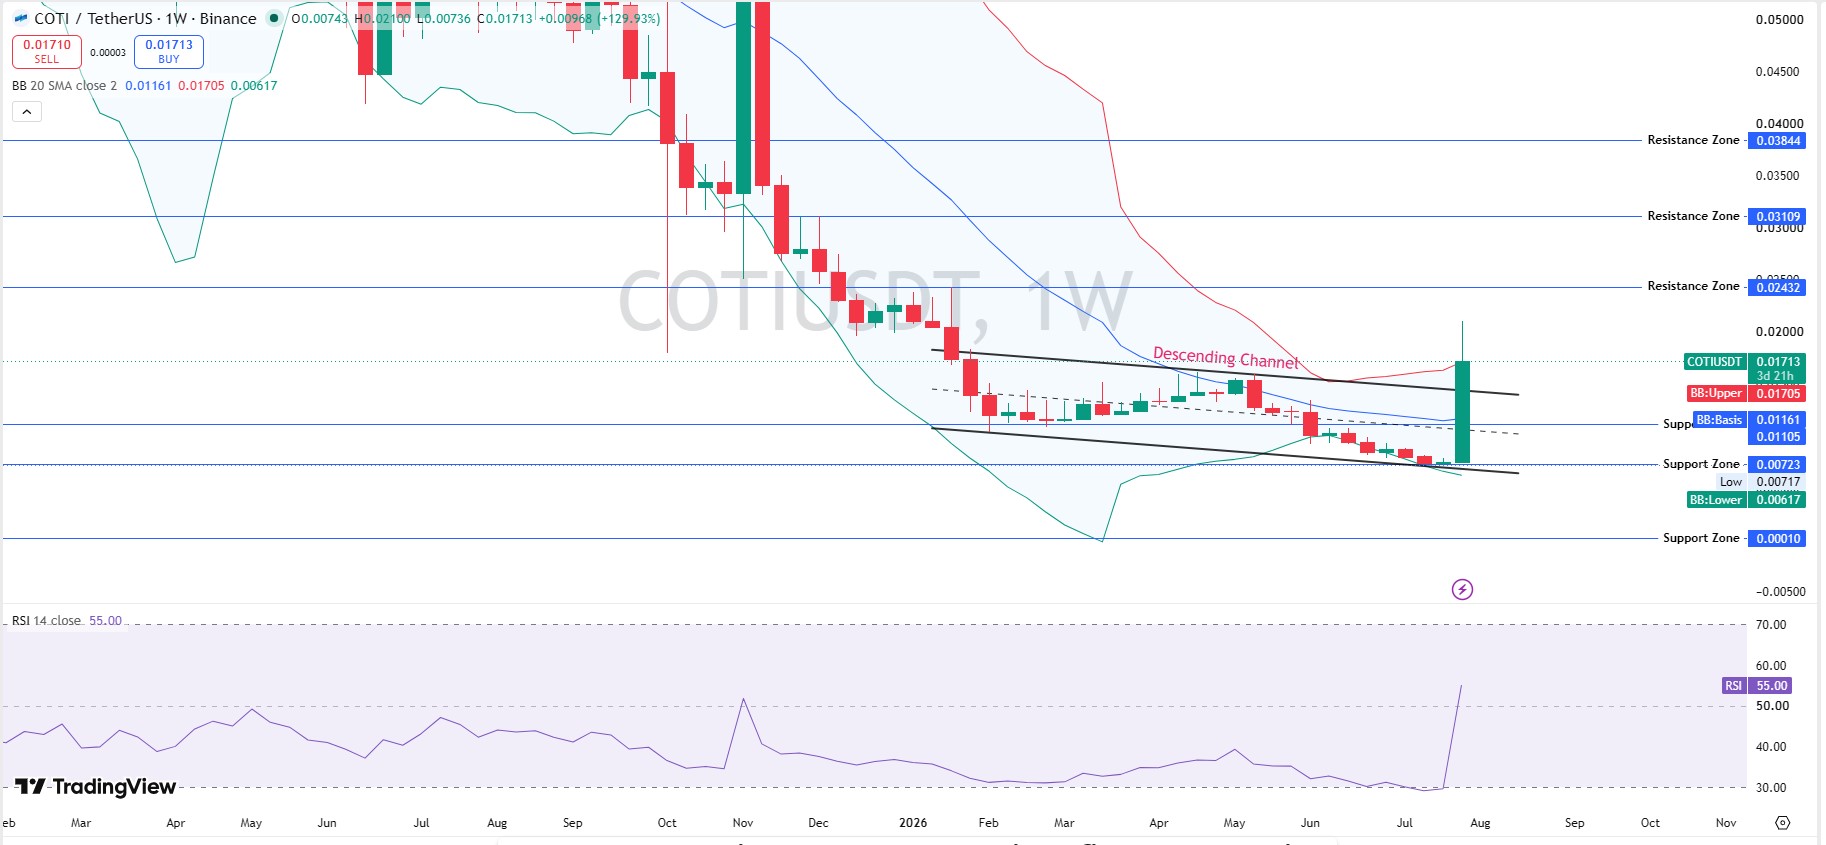
The weekly chart is calmer, and it's the part a lot of quick breakouts miss. $COTI broke out of a descending channel that had capped price since late last year, and the current weekly candle, still open with roughly 3 days and 21 hours left, is up 129.93% from its $0.00743 open.
Weekly RSI reads 55.00, nowhere near overbought. That gap between daily (87.5) and weekly (55.0) momentum is the whole tension in this chart, and it's the reason a $COTI price prediction this week looks a lot shakier than a $COTI price prediction next week or next month.
The weekly Bollinger Bands (20 SMA, 2 close) show a basis of $0.01161, an upper band at $0.01705, and a lower band at $0.00617. Unlike the daily chart, price here is sitting right at the upper band instead of miles above it, which is a big part of why the weekly setup looks healthier than the daily one.
COTI Support and Resistance Levels
$COTI resistance levels start near $0.02100 (today's high), then $0.02432, then $0.03109, and a longer-range zone at $0.03844.
$COTI support levels sit at $0.01477, the daily Bollinger upper band that price just broke through and that often flips into support after a breakout. Below that, $0.01105, then $0.00723.
The daily Bollinger basis at $0.00888 is a deeper floor worth marking, though a drop that far would undo most of this week's gain.
A daily close back under $0.01477 would put the breakout in doubt. A close under $0.01105 would be a clearer break of the bullish structure. These are the levels that matter for both a short-term COTI price prediction tomorrow and a longer $COTI long-term price prediction.
Tokenomics And Whale Concentration
$COTI has a max supply near 3.18 billion tokens, per CoinMarketCap's COTI page. Onchain market cap sits around $54.15M, with circulating-supply market cap closer to $50.34M. Holder count is 29,341, up about 0.06% in the last 24 hours.
Now, the risk that actually matters here is the piece most $COTI crypto price predictions skip.
Top-100 wallets hold 84.86% of supply. The top 10 alone hold 44.16%. Whale wallets, just 53 addresses, 0.18% of all holders, control 80.52% of market cap. The Gini distribution score sits at 0.9812, with 24 wallets each holding at least 1% of total supply.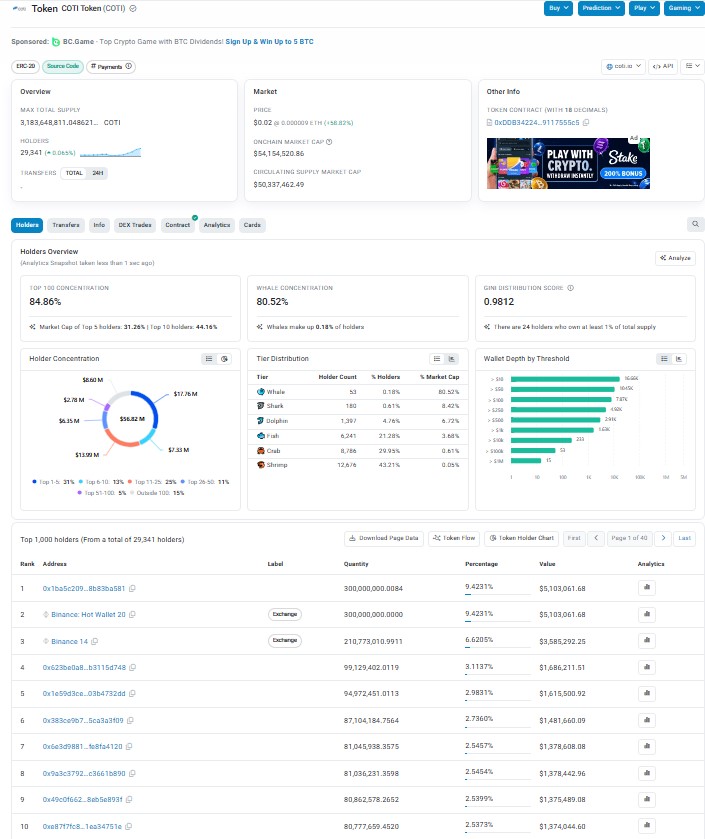
That's about as concentrated as a token gets.
Tier breakdown, per on-chain holder analytics: Whale tier (53 wallets) holds 80.52% of cap. Shark tier (180 wallets) holds 8.42%. Dolphin (1,397 wallets) holds 6.72%. Fish (6,241 wallets) holds 3.68%. Crab and shrimp tiers, nearly 21,500 wallets combined, hold under 1% between them.
The top wallet, unlabeled, holds 300,000,000.0084 COTI (9.42%, roughly $5.1M). The second-largest is labeled Binance Hot Wallet 20, holding an almost identical 300,000,000.0000 COTI. Third is Binance 14, at 6.62%.
We can't confirm what the top unlabeled wallet actually is. It could be a treasury, a vesting contract, or an individual holder, and that distinction matters before calling this pure whale risk. The two Binance-labeled wallets are custodial exchange balances, not necessarily a single seller waiting to dump.
The $COTI contract, an ERC-20 token on 18 decimals, is verifiable directly on Etherscan's token page.
Where $COTI Is Actually Trading
Binance carries the overwhelming majority of futures volume at $755.91M, followed by Bybit near $142.25M, Bitget around $84.20M, and Bitunix at $40.15M, with smaller slices on MEXC and Gate.
That futures volume, over $1 billion across venues, dwarfs COTI's roughly $54M on-chain market cap. When derivatives volume runs that far ahead of the underlying market cap, leverage is doing the heavy lifting, not organic spot accumulation.
Binance's dominance also means any liquidity issue on that single venue would ripple through $COTI fast. Worth watching alongside our crypto exchange listing tracker for where new liquidity tends to show up first.
$COTI Price Prediction: Scenarios By Timeframe
Treat this table as a COTI price forecast for 2026 across horizons, not as a signal to copy directly. It covers a $COTI price prediction today, a COTI price prediction this month, and a $COTI prediction for 2026 side by side.
| Timeframe | Bull Case | Base Case | Bear Case |
|---|---|---|---|
| 24H | Reclaims $0.021 and pushes toward $0.0243 as the squeeze continues (Probability: Moderate). | Cools to $0.0155–$0.017 as RSI unwinds (Probability: High). | Fails at $0.0155 and slips toward $0.0148 (Probability: Low–Moderate). |
| 7D | A weekly close above $0.0171 keeps the structure bullish and opens a path to $0.0243 (Probability: Moderate). | Range-bound between $0.0130–$0.019 while the breakout gets retested (Probability: High). | Breaks $0.0148 and retests the $0.0111 support zone (Probability: Low). |
| 2026 | Privacy narrative and broader altcoin rotation carry COTI toward $0.0311–$0.0384, a realistic cycle target (Probability: Low–Moderate). | Drifts within a $0.015–$0.025 range, tracking broader sector sentiment (Probability: Moderate). | Concentration-driven selling or a fading narrative drags COTI toward $0.0072–$0.0089 (Probability: Low–Moderate). |
Invalidation for the bullish thesis is a daily close under $0.01477. A close under $0.01105 would confirm a deeper pullback. These are directional reads, not guarantees, and the probability labels reflect relative likelihood, not statistical certainty. A longer COTI price prediction for 2026 to 2030 would need the privacy narrative to hold well past this week's headlines, plus real usage on the privacy portal, not just posts about it.
Will COTI Reach $1? Can It Reach $5?
Not on this move, and not close. Getting from $0.01699 to $1 is close to a 59x increase; getting to $5 is roughly a 294x increase. At the current circulating supply, $1 COTI would put the market cap north of $2.9 billion, a complete re-rating this breakout doesn't support.
A more grounded question is whether COTI's price will go up toward its own prior highs. This cycle's realistic upside sits closer to $0.03-$0.04, the resistance band flagged in the scenario table above. That's not off the table as a genuine COTI long-term price prediction if the privacy story holds. But $1 or $5 isn't a near-term target.
COTI Market Outlook: Risks To Watch
Whale concentration tops the list. A Gini score of 0.9812 and 53 wallets controlling 80.52% of market cap are a structural risk that doesn't go away just because the price is green.
Leverage is next. Futures volume running multiples above the onchain market cap means this move can unwind as fast as it built.
And the narrative is unconfirmed as a hard catalyst; a privacy portal launch and a couple of viral posts aren't the same as a listing or an audit.
Whether COTI is a good investment right now depends on risk tolerance, since this setup mixes a real technical breakout with real concentration risk. For wider cycle context, see our Ethereum price prediction 2026 coverage.
Glossary
-
RSI (Relative Strength Index): A 0-100 momentum gauge; above 70 usually flags an overbought, stretched move.
-
Bollinger Bands: Bands plotted around a moving average that widen and narrow with volatility; price trading above the upper band signals extension.
-
Falling Wedge / Descending Channel: Chart patterns where price compresses downward; both often resolve with an upside breakout price target.
-
Gini Score: A 0-to-1 measure of distribution; closer to 1 means supply sits in very few hands.
-
FDV (Fully Diluted Valuation): What market cap would be if every token, including any still locked, were circulating.
Methodology
Chart levels came from COTI/USDT daily and weekly charts on Binance via TradingView, using RSI-14 and 20-period Bollinger Bands, captured on July 30, 2026. Supply, market cap, and price data came from CoinMarketCap; holder concentration and Gini score from on-chain wallet analytics, cross-checked on Etherscan; and liquidation and futures volume from Coinglass.
One dashboard showed a 24-hour gain closer to 57% at its own snapshot time; the TradingView close of $0.01699 is the figure used throughout this piece. This is a live snapshot, and levels can shift as new data comes in.
Disclaimer: This is speculative market commentary, not financial or investment advice. Crypto assets are volatile and can lose most or all of their value. Data is current as of July 30, 2026; verify live figures before trading.









.jpg)








