Dogecoin Price Prediction: Is a New DOGE Bull Run Starting?


Dogecoin started as a joke back in 2013, a Shiba Inu meme bolted onto a Litecoin fork by two developers who weren't even trying to build the next big thing.
Funny how that worked out. It's survived crashes, celebrity tweets, and entire market cycles that killed off coins with far more "serious" roadmaps.
So here we are again, another month, another dogecoin price prediction to work through.
$DOGE is currently sitting around $0.0702, and the question everyone wants answered is simple: what now?
Dogecoin Price Prediction: Live Market Data
$DOGE is currently trading at $0.0702 right now, up 0.5% on the day. 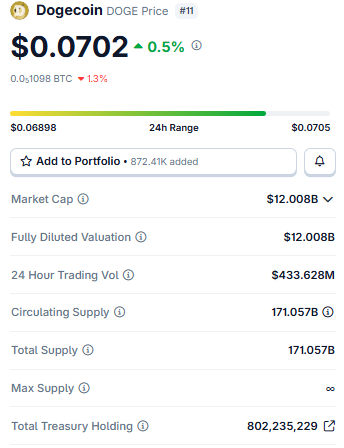
Source: $DOGE Market Cap Data Taken From Coingecko, data as of Aug 04, 2026. Figures may vary slightly across other tracking websites.
Market cap sits at $12.008B. Since $DOGE has no max supply cap, fully diluted valuation lines up with that same figure exactly; no dilution math needed.
Circulating and total supply both come in at 171.057B tokens.
Daily volume of $433.628M keeps this market properly liquid, and treasury holdings north of 802 million DOGE are being tracked publicly too, a level of transparency older coins rarely bother with.
On-Chain and Market Drivers
The liquidation heatmap is sending mixed signals right now, worth paying attention to.
Over the last 24 hours, $258.82K in short positions got liquidated against $169.81K in longs, suggesting shorts got caught leaning the wrong way as $DOGE climbed. But look closer at the last few hours, and the pattern flips entirely. 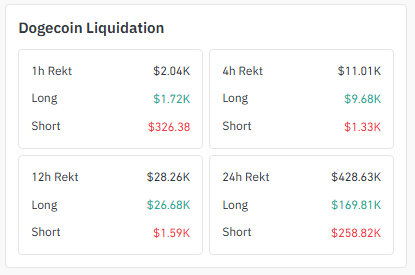
Source: Liquidation Data Taken From Coinglass.
The 12-hour window shows $26.68K in longs rekt versus just $1.59K in shorts, and the 4-hour window tells a similar story.
So the bigger trend has punished shorts, sure, but the most recent pullback has been catching longs off guard instead.
Exchange volume is heavily stacked on Binance at $250.90M, more than the rest of the field put together.
OKX trails at $158.91M, then Bybit at $73.65M and MEXC at $67.24M. 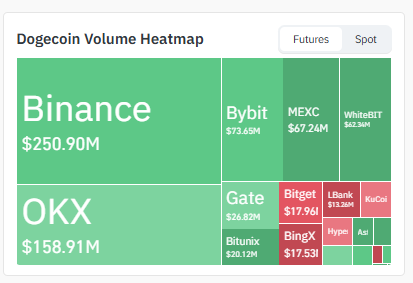
Source: Volume Heatmap Data Taken From Coinglass.
Depth like that on the top exchanges usually means genuine price discovery is happening, not some thin order book getting pushed around by one player.
Dogecoin News Today
Social sentiment around $DOGE has been leaning bullish lately, and it's mostly whale-buying headlines driving that mood rather than any single technical call.
The $200 million DOGE purchase making the rounds fits a broader accumulation pattern that's been quietly building over recent weeks.

Source: Data Taken From @_dogegod_ , X Account.
Whether that turns into a confirmed breakout above the descending channel is still the open question nobody can answer yet.
Historically speaking, $DOGE rallies tend to arrive fast once a key trendline finally breaks, often outrunning more measured altcoin moves in the process, which is exactly why traders are watching this channel test so closely.
Technical Analysis of Dogecoin
1-Hour Chart Analysis
Zoom into the hourly , and DOGE is squeezed into a symmetrical triangle, with two converging trendlines pinching the price toward the apex. 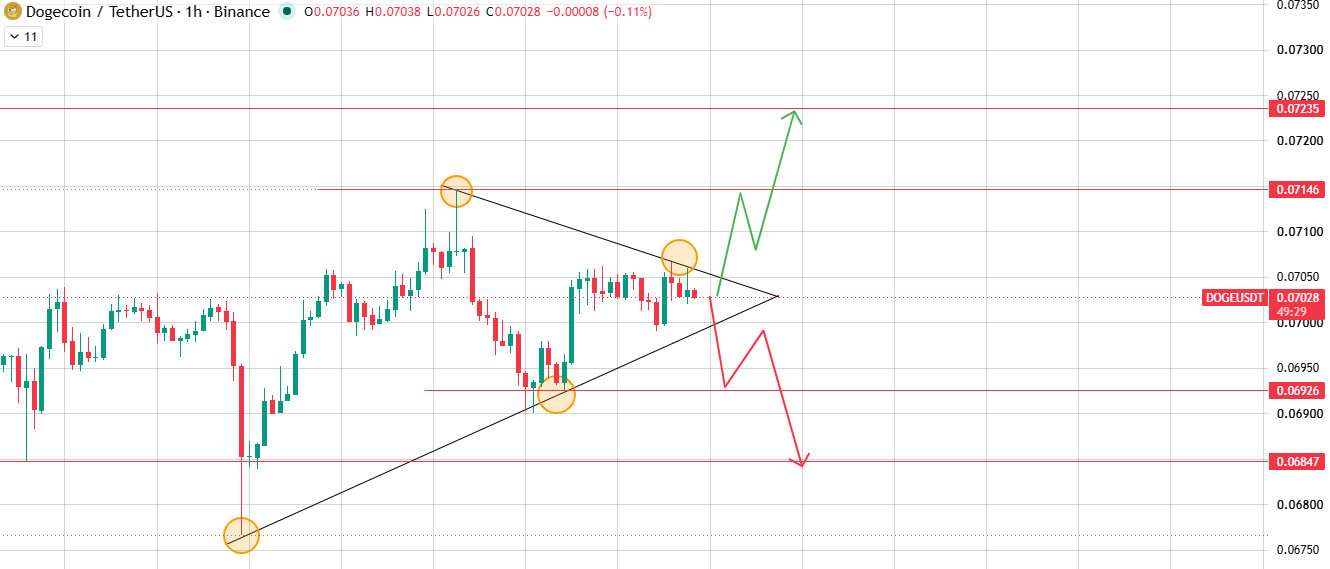
Source: Chart Taken From TradingView.
Resistance sits at $0.07146 and $0.07235. Support holds at $0.06926 and $0.06847.
A volume-backed bullish breakout above the upper trendline should send the price toward those resistance levels quickly.
Break down below $0.06926 instead, and that's a bearish breakdown that opens the door to $0.06847 and beyond.
Triangles wound this tight don't usually stay quiet much longer.
Daily Chart Analysis
The chart isn't subtle about this one. $DOGE has been boxed inside a clearly marked descending channel for weeks now, bouncing between a falling upper boundary and a falling lower boundary. 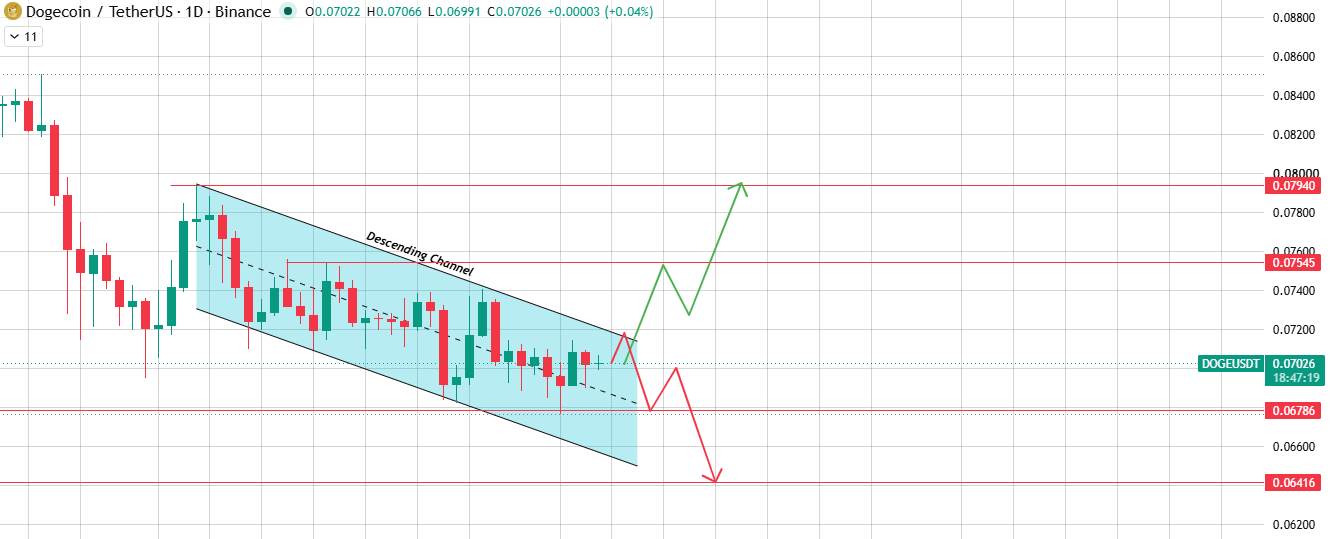
Source: Chart Taken From TradingView.
Price is testing that upper boundary right now; if it breaks the upper boundary of the structure's first level, $0.07545. Clear it with real volume behind the move, and $0.07940 becomes the next logical level.
Get rejected here again, though, and odds favor a slide back to $0.06786, with a deeper support zone waiting near $0.06416 if the selling picks up steam. Textbook channel test.
The next few weeks probably hinge on how this plays out.
Bull, Base, and Bear Case
What breaks the bull case? A rejection right at $0.07545 on heavy sell volume. What breaks the bear case? Buyers are simply defending $0.06786 and refusing to give it up.
Catalysts to Watch
Whale accumulation is the story getting attention right now. A widely followed Dogecoin-focused account recently flagged large wallets scooping up another 200 million DOGE on Robinhood, worth close to $14M.
Does that guarantee a breakout? No. But it does suggest bigger players see value at current levels, and that's worth something.
Beyond the whale watching, $DOGE's price target still tracks BTC dominance fairly closely, and a dominance chart trending down usually gives meme coins more room to breathe.
ETH correlation matters less here than for most altcoins, but broader risk appetite across the whole market still sets the tone. Keep an eye on volume the moment the price nears $0.07545.
Long-Term Outlook
Pull the lens back further and $DOGE is still well below its 2021 all-time high, a level driven largely by a once-in-a-cycle wave of retail mania that probably won't repeat in quite the same shape again.
And yet, somehow, the coin keeps holding a top-ten market cap ranking through multiple bear markets that wiped out projects with far stronger fundamentals on paper.
A sustained break above the current descending channel would be an encouraging sign technically, but a real long-term recovery likely needs broader crypto market strength behind it, not just a DOGE-specific spark.
Holding above the channel's lower boundary on pullbacks remains the marker worth watching.
How to Buy Dogecoin
Buying DOGE isn't complicated. It's listed on nearly every major exchange, Binance, OKX, Bybit, and MEXC; take your pick. Deposit funds, search the DOGE/USDT pair, place a market or limit order.
First time doing this? Start small. Sentiment here can shift fast, and oversized positions punish that volatility hard.
Once you're holding a meaningful stack, move it to a wallet you actually control rather than leaving it parked on an exchange.
Glossary
Descending Channel: Two lines drifting downward side by side, one hugging the lower highs, the other the lower lows. Price gets boxed in until something finally gives.
Symmetrical Triangle: Picture two trendlines closing in on each other from opposite directions. The tighter that gap gets, the harder the price usually snaps once it breaks free.
Liquidation Heatmap: Think of it as a pain map, showing exactly where over-leveraged longs and shorts get forced out as price crosses certain levels.
Support Zone / Resistance Level: Spots on the chart where buyers or sellers have shown up in size before. Not a guarantee they show up again, but traders watch these areas closely anyway.
BTC Dominance: How much of the whole crypto market Bitcoin alone soaks up. When it drops, altcoins and meme coins usually get more room to move.
Methodology: price levels sourced directly from 1D and 1H TradingView charts; liquidation and volume data sourced from Coinglass; no data extrapolated beyond visible chart structure.
Disclaimer: This article is for informational purposes only and does not constitute financial advice. Cryptocurrency markets, including DOGE, are highly volatile and speculative. Price levels discussed are derived from technical chart analysis of TradingView data as of August 4, 2026, and are probability-based scenarios, not guarantees. Always conduct independent research and consult a licensed financial advisor before making investment decisions.


















