Dogecoin Price Prediction: DOGE Tests Wedge Breakout at Key Resistance


Here's a teaser for you: a coin that's been grinding sideways for weeks just tapped the edge of a pattern traders have been staring at since 2023, and the next candle or two might decide where it goes from here.
Why Everyone's Watching DOGE's Next Move Right Now
Dogecoin price prediction searches tend to spike right when a chart gets quiet before it doesn't, and that's roughly where DOGE sits today. Nothing flashy happened. No exchange listing, no Elon tweet storm, no sudden headline.
And yet the setup underneath is anything but boring. For readers comparing this pattern against other coins right now, our crypto price prediction hub tracks similar setups across the market.
A short-term pattern just broke one way. A much bigger, older pattern is still deciding. Layer in a Wall Street ETF story that's gone quiet after one lonely inflow day, plus almost a million dollars in forced liquidations over 24 hours, and you've got a coin sitting at a genuine fork.
So which pattern wins?
Key Takeaways
-
DOGE trades near $0.0731 (snapshot: July 27, 2026, 01:27 UTC), roughly flat to up 0.2 to 0.4% over 24 hours, according to live pricing on CoinMarketCap.
-
The 4-hour chart broke a falling wedge; RSI there sits at 58.15, still room before it's overbought.
-
Weekly RSI reads 33.88, under neutral, inside a descending triangle that's held since late 2023.
-
4H resistance sits at $0.07404, then $0.08435, and $0.08729. Support sits at $0.06820, then $0.06532.
-
Market cap is $11.34B (rank #10-11), with 24H volume near $537.02M, down about 32.81% from the prior day.
-
US spot DOGE ETFs hold just $9.88M in net assets, about 0.09% of DOGE's market cap, after their first inflow day since June 17.
-
24H futures liquidations hit $951.07K, and longs took the bigger hit at $610.17K.
Where DOGE Stands Right Now
DOGE last changed hands around $0.0731, inside a tight 24-hour range between roughly $0.0725 and $0.0740. Turns out, that range itself is the story. It's the same zone the coin has bounced inside for weeks.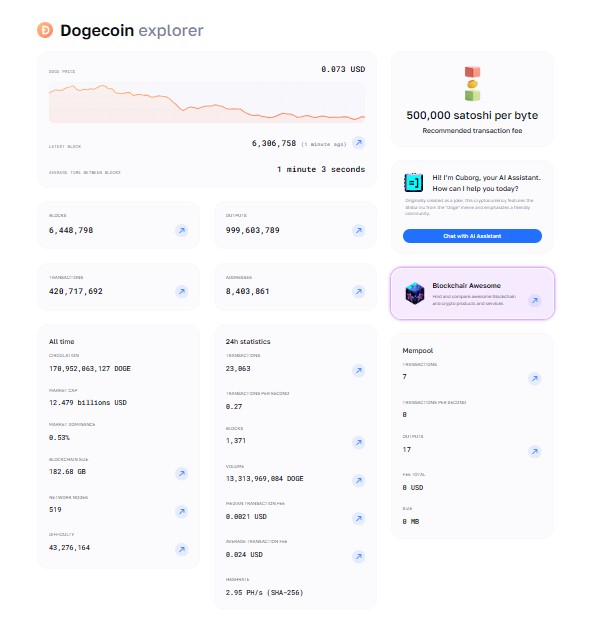
Source: Dogecoin Block Explorer
Circulating supply sits at 155.24B DOGE against an uncapped max supply, so dilution isn't the worry it is for smaller-cap tokens. But Dogecoin circulating and mined supply data shows an all-time mined total near 178.95B DOGE, a gap worth noting since trackers count "circulating" supply differently than raw coins ever produced. Readers who followed our earlier DOGE falling channel breakdown will recognize this same range-bound behavior.
The all-time high, $0.7376, was set May 8, 2021. The current price sits about 90% below that peak. The all-time low, $0.00008547, dates back to May 7, 2015. meaning today's price is still up over 85,000% from that floor. Context matters both ways.
What's Actually Moving the Chart Today
Here's the thing: there's no single headline driving this. What we've got instead is a coin caught between conflicting signals.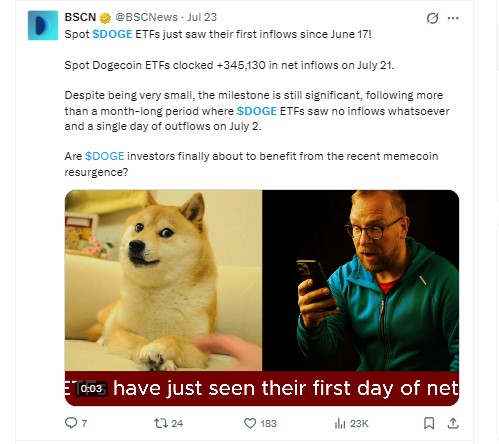
Spot ETF flows finally turned positive on July 21, pulling in $345,130, the first inflow since June 17, DOGE ETF inflow update for July 21, 2026. But that followed more than a month of nothing, and one closed fund still shows a net outflow since launch. Our deeper DOGE ETF inflows breakdown covers how thin that demand really is.
Meanwhile, futures traders got squeezed. Liquidations totaled $951.07K over 24 hours, with longs eating $610.17K of that. Someone bet big on a bounce and paid for it.
Technical Analysis: 4-Hour Chart
Price spent weeks inside a falling wedge, a pattern where lower highs and lower lows converge, that typically resolves upward. It broke that wedge and now sits right against the first resistance zone at $0.07404, a setup visible on the live DOGE/USDT chart on TradingView.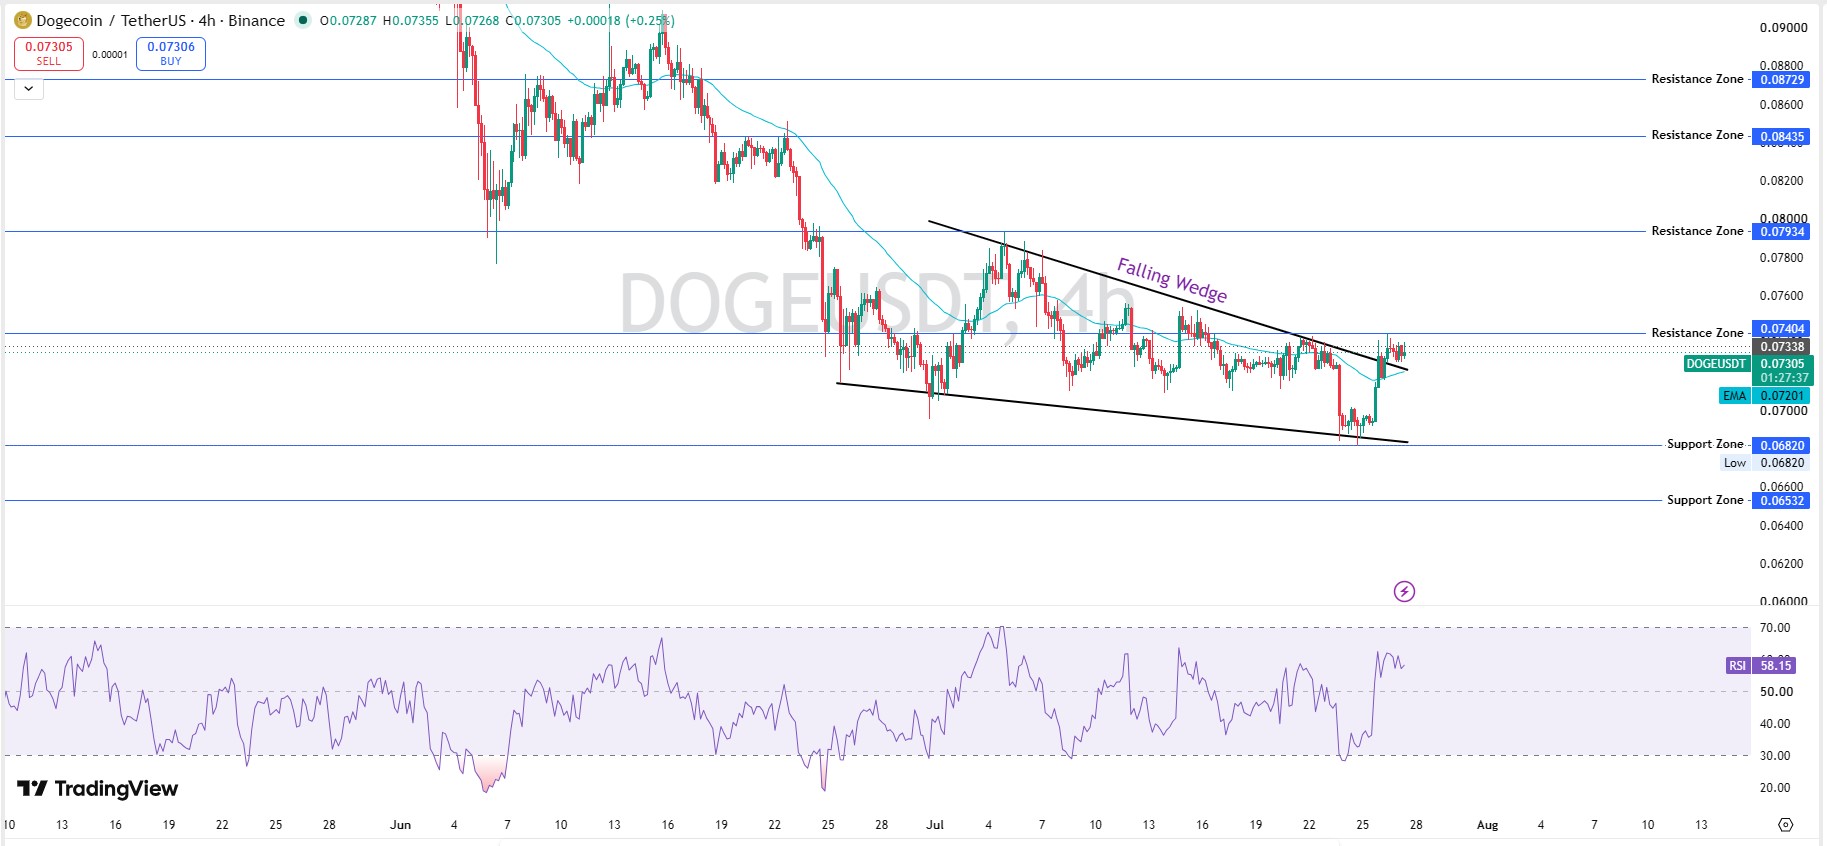
RSI reads 58.15. Not overbought. Not weak either. The EMA (a moving average that weights recent candles more heavily) sits at $0.07201, just under the current price, which confirms the short-term trend has flipped positive, at least for now. This mirrors the setup we flagged in our wedge breakout analysis a few weeks back.
| Level | Price |
|---|---|
| Resistance 3 | $0.08729 |
| Resistance 2 | $0.08435 |
| Resistance 1 | $0.07404 |
| Current | $0.0731 |
| Support 1 (EMA) | $0.07201 |
| Support 2 | $0.06820 |
| Support 3 | $0.06532 |
Technical Analysis: DOGE weekly descending-triangle chart with RSI
Zoom out and the picture changes. The weekly candle opened near $0.07339 and closed around $0.07317, down about 0.29%, sitting near the tip of a descending triangle that's compressed since late 2023.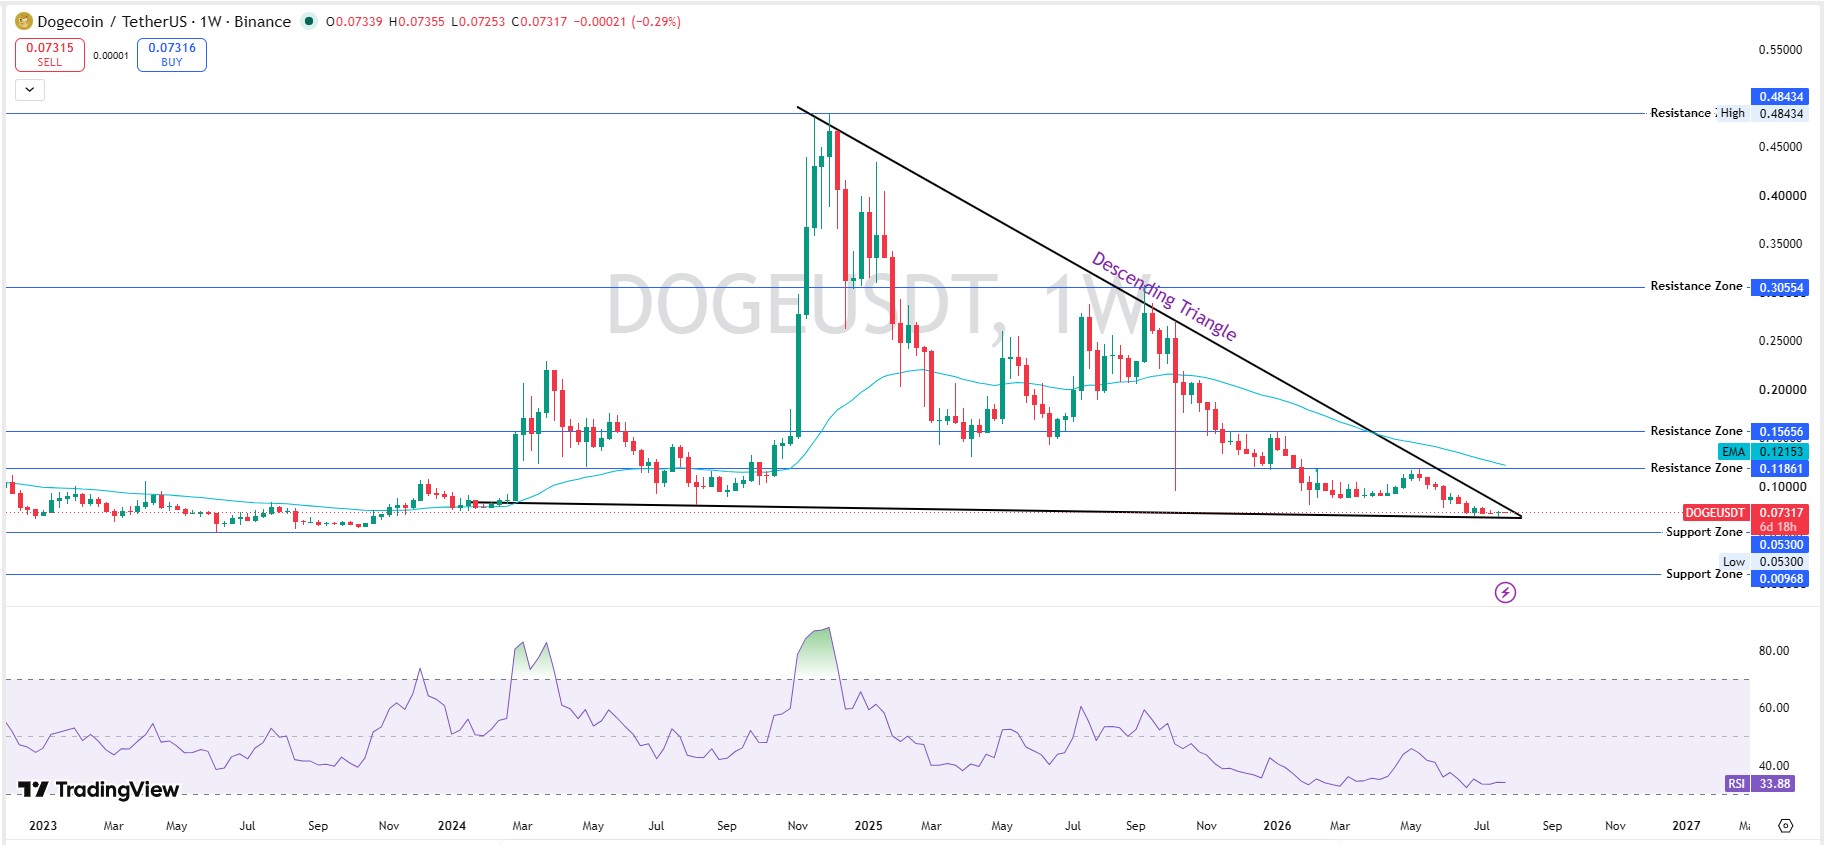
Weekly RSI reads 33.88. Still under 50. That's the real tension in this Dogecoin price prediction: a short-term bounce hasn't done much to fix a momentum picture that's been weak for years, something we explored in one breakout, everything changes.
| Level | Price |
|---|---|
| Resistance 3 | $0.48434 |
| Resistance 2 | $0.30554 |
| Resistance 1 | $0.11861 |
| Current | $0.0731 |
| Support 1 | $0.05300 |
| Support 2 | $0.00968 |
Liquidity, Volume, and Where the Trading Actually Happens
Futures volume is dominated by two venues. Binance leads with $316.62M; OKX follows at $255.63M, per the live DOGE futures data on CoinGlass. Bybit, MEXC, and Gate round out the next tier at $83.10M, $76.00M, and $45.09M.
24H spot volume near $537.02M against an $11.34B Market cap works out to a vol-to-cap ratio of 4.75%. Not thin, not explosive. Ordinary, honestly, for a top-10 coin on an average day. Anyone weighing whether more venues could pick up DOGE flow should check our exchange listing tracker.
ETF Flows Tell a Quieter Story
Three US spot DOGE ETFs exist: GDOG (Grayscale), TDOG (21Shares), and BWOW (Bitwise), per their respective SEC filings and exchange listing notices. Combined, they hold $9.88M in net assets, a rounding error against DOGE's full market cap, based on SoSoValue's US DOGE Spot ETF aggregated data.
GDOG carries the most, $6.78M, on $11.30M in cumulative inflows. TDOG sits at $2.64M in net assets. BWOW is actually negative on cumulative flows, down $1.38M since it started trading. Institutional appetite here looks tepid at best, a theme we return to in our DOGE rebound outlook.
Bull, Base, Bear Scenarios
Not financial advice, just three paths built off the chart. Scenario probabilities are editorial estimates based on current support and resistance, RSI positioning, EMA structure, recent volume, ETF flows, and futures liquidations — they are not statistically modeled probabilities.
Bull (30%): Daily close above $0.07404 opens a path toward $0.08435 within 7 to 14 days. Invalidation: close back below $0.0700.
Base (45%): Range between $0.068 and $0.079 for 7 to 30 days. Invalidation: a weekly close outside that band.
Bear (25%): A break of the EMA support near $0.07201 sends the price toward $0.06820, then possibly $0.06532, within 30 days. Invalidation: price holding above $0.072 for over a week. Traders wanting to flag any DOGE catalysts ahead of these windows can add the coin to our coin events calendar.
Price Forecast Table
| Timeframe | Bear | Base | Bull |
|---|---|---|---|
| 24H | $0.0705 | $0.0731 | $0.0748 |
| 7D | $0.0660 | $0.0720 | $0.0790 |
| 30D | $0.0580 | $0.0700 | $0.0880 |
| Long Term (2026) | $0.0400 | $0.0850 | $0.1500 |
What to Watch Next
A handful of signals will likely decide which scenario plays out from here:
4H close above $0.07404
Breakout volume confirming the move
Retest of the $0.07201–$0.07404 zone
Weekly close relative to triangle resistance
ETF daily flows
Funding rate
Open interest
Liquidations
Broader Bitcoin trend
Key Risks
Weekly RSI stuck under neutral inside a multi-year descending triangle is the biggest overhang here. ETF demand looks thin and inconsistent, based on SoSoValue's dogecoin coin page. Longs just got liquidated for over half a million dollars in a day, which can mean more forced selling if support cracks.
And broader crypto sentiment, not just DOGE's own chart, can override any single setup. Readers weighing DOGE against the market's largest asset can cross-check it against our Bitcoin price prediction 2026 coverage.
Glossary
RSI: a 0-100 momentum gauge; above 70 is overbought, below 30 is oversold. EMA: a moving average that weights recent price action more heavily than older data.
FDV: market cap if every token that could ever exist were circulating today. Falling Wedge: a converging chart pattern that usually breaks upward. Descending Triangle: a pattern with flat support and falling resistance, often bearish when broken down.
Liquidation: the forced closing of a leveraged futures position when losses hit the margin limit.
Newer traders can find plainer breakdowns of these terms across our latest crypto news coverage.
Disclaimer: For informational purposes only, not financial advice. Crypto markets are volatile. Do your own research before investing.
Also read: