Cardano Price Prediction: ADA Eyes 18% Rally After Breakout


Cardano price prediction searches are climbing again as ADA pushes into a zone that has capped it before.
The coin has spent weeks building a steady staircase higher and now sits right at the level that decides whether this turns into a much bigger move or just another pause.
The setup below breaks down exactly what the chart is showing and what comes next.
The levels described here apply strictly to the 4-hour timeframe covered and should be rechecked if the price closes beyond the stated range.
Key Takeaways
-
ADA has been climbing steadily along an ascending trendline that has held as support
-
Price is now testing $0.1999, a level that has been capped before
-
A close above $0.1999 opens the door to $0.2205 and then $0.2322
-
A pullback to the trendline or $0.1807 that holds keeps the same upside targets in play
-
$0.1534 only comes into focus on a news-driven break, with $0.1381 the level after that
-
Shorts have taken the bulk of liquidations across the 4h, 12h, and 24h windows
Cardano Price Right Now
| Metric | Value |
| Price | $0.1956 |
| 24h Change | +5.68% (+$0.0105) |
| Market Cap | $7.11B |
| Futures Volume (24h) | $978.95M |
| Spot Volume (24h) | $175.08M |
| Open Interest | $544.73M |
| Circulating Supply | 36.50B $ADA |
| Total Supply | 44.99B $ADA |
| Max Supply | 45.00B $ADA |
Open interest refers to the total value of ADA derivative contracts still open across exchanges, a rough gauge of active leveraged positioning.
Chart source: ADA/USDT 4-hour perpetual contract, TradingView, Binance data feed, captured August 4, 11:03 AM IST (05:33 AM UTC). Market cap, volume, and supply figures from ADA market data on CoinGlass were captured the same day.
Methodology and Data Sources
This Cardano price prediction uses the ADA 4-hour chart on Binance via TradingView for price structure, with volume, open interest, and market cap figures from CoinGlass, and liquidation flow from CoinGlass's ADA liquidation tracker.
Readers comparing this setup against how ADA has handled similar zones before can check ADA breakout confirmation levels.
All levels are treated as invalidated only on a confirmed candle close beyond the stated trigger, not an intraday wick.
Cardano Ecosystem Update: Injective Testnet Connection
Adding some context here, a Cardano-focused account reported on X that ADA is now connected with Injective's INJ on testnet, powered by IBC, the standard used for cross-chain asset transfers and messaging.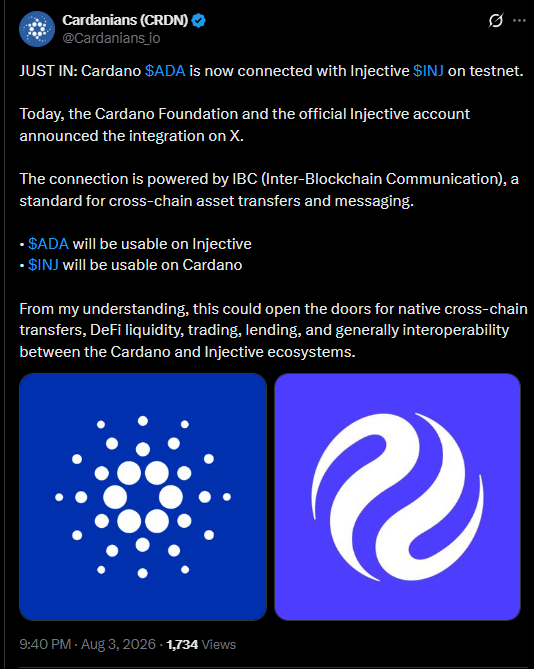
The post states ADA becomes usable on Injective and INJ becomes usable on Cardano, which could eventually open the door to cross-chain transfers, shared liquidity, and lending between the two ecosystems.
This is a testnet integration, not a mainnet launch, so it should be treated as an early development rather than a completed feature.
For the fuller monthly picture beyond this single setup, see the latest Cardano price setup.
Source: X post by Cardanians (@Cardanians_io), August 3, 9:40 PM at time of capture. Network activity does not move price by itself, but it adds fundamental context worth tracking alongside this ADA technical analysis.
Liquidation Data Today
Liquidation activity leans toward shorts across almost every window, a pattern that lines up with ADA's move higher.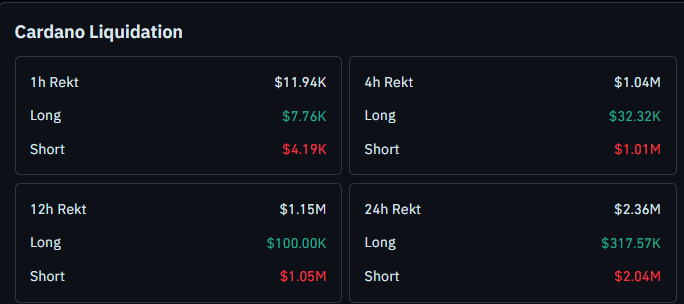
Over the past hour, $11.94K was liquidated, with $7.76K from longs and $4.19K from shorts, the one window where longs led.
The 4-hour window flips hard toward shorts, with $1.04M in total liquidations, of which $1.01M came from shorts against just $32.32K from longs.
The 12-hour window shows $1.15M total, $1.05M from shorts versus $100.00K from longs.
Across the full 24 hours, liquidations hit $2.36M, and shorts account for $2.04M of that figure, while longs make up $317.57K.
This heavy short-side unwind across the longer windows fits a coin that broke a falling structure and kept climbing, a dynamic also covered in the piece on whether ADA sees a crash.
Source: ADA liquidation data, CoinGlass, checked August 4, around 11:03 AM IST.
Cardano Price Prediction: 4-Hour Chart Analysis
Can $ADA break $0.20? A close above $0.1999 would confirm it and open the path toward $0.2205 and $0.2322, roughly 2.3% and 18.8% above the current price.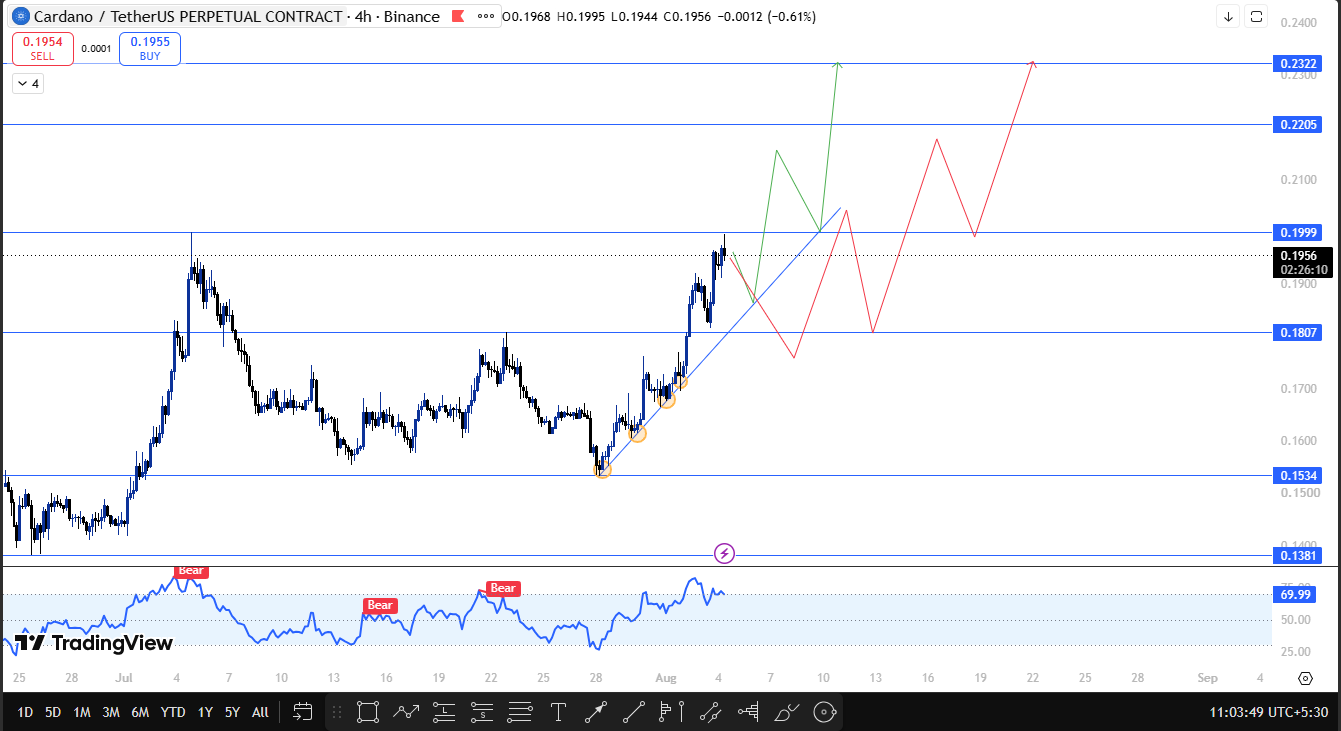
A rejection here instead points back to the trendline or $0.1807 as the next area to watch for support.
$ADA has been climbing along an ascending trendline for weeks, using it as support on every dip rather than getting rejected from above like it did earlier in the cycle.
That is a meaningfully different structure from the descending pattern this coin was stuck in before, and it is why this setup reads differently from ADA's prior failed attempts to hold gains.
Price is now testing $0.1999, a level that capped it before. On the lower panel, the chart's built-in momentum indicator RSI is reading 69.99, well off the bear tags.
It printed three separate times during the earlier downtrend, suggesting momentum has genuinely shifted rather than just spiking on one green candle.
If it closes above $0.1999, $0.2205, and then $0.2322 comes into view, a scenario is broken down further in Cardano's key flip zone breakdown.
If price gets rejected here and pulls back instead, a hold at the trendline or at $0.1807, about 7.5% below current price, would keep the same $0.1999 to $0.2322 targets on the table.
Glossary
Ascending Trendline: An upward-sloping line connecting successive higher lows, used to track support during an uptrend.
Open Interest: The total value of derivative contracts, like futures, that remain open and have not yet been settled or closed.
Liquidation: What happens when a leveraged trade gets forcibly closed because the trader ran out of margin to keep it open.
IBC (Inter-Blockchain Communication): A protocol standard that allows different blockchains to transfer assets and messages between each other.
Technical Outlook Snapshot
| Indicator | Signal |
| Trend | Ascending trendline holding as support since the recent low |
| Structure | Testing prior resistance at $0.1999 for the first time since the breakout |
| Momentum Oscillator(RSI) | Reading 69.99, no Bear tag active, a shift from three earlier Bear signals |
| Liquidations | Shorts dominated the 4h, 12h, and 24h windows. |
| BTC Correlation | General market context: no independent dominance data tracked in this setup |
Support and Resistance Levels to Watch
| Type | Level | Note | % From CMP |
| Extended Target | $0.2322 | Only reachable after clearing $0.2205 | +18.70% |
| Resistance 2 | $0.2205 | Second target on continuation | +12.70% |
| Resistance 1 | $0.1999 | Current test zone, confirmation trigger | +2.20% |
| Current Price | $0.1956 | Trading just under resistance | - |
| Support 1 | $0.1807 | Pullback retest zone keeps targets intact if held | -7.52% |
| Support 2 | $0.1534 | Rare, news-driven break scenario only | -21.50% |
| Support 3 | $0.1381 | Next level down if $0.1534 fails | -29.32% |
Risk-Reward Table
| Case | Trigger | Target |
| Bull Case | Closes above $0.1999 | Move toward $0.2205, then $0.2322. |
| Pullback-Hold Case | Retests the trendline at $0.1807 and holds | The same $0.1999 to $0.2322 targets remain valid. |
| Bear Case | Breaks and closes below $0.1534 on news-driven volatility | Slide toward $0.1381. |
What should invalidate the setup?
This Cardano price forecast stays constructive as long as ADA holds the ascending trendline or $0.1807 on pullbacks.
A confirmed close below $0.1534, which the chart flags as a rare, largely news-driven scenario, would invalidate the broader structure and put $0.1381 in focus.
Under normal conditions without a major news shock, $0.1534 is not expected to come into play.
Downside Risk
False breakouts happen, and a close above $0.1999 followed by a quick reversal back below it would weaken the bullish case even without breaking $0.1807.
Liquidity can also thin out fast around round-number resistance zones like $0.1999 and $0.20, leading to sharper wicks than the 4-hour candles suggest.
Traders using leverage should also account for the fact that a sudden move against a position can trigger liquidation well before a level like $0.1807 or $0.1534 is actually reached on the chart.
Bitcoin Impact on Cardano
This setup is based on ADA's own 4-hour chart, but Bitcoin still tends to set the tone for how far altcoin moves like this one can extend.
A steady or rising Bitcoin generally improves the odds of ADA clearing $0.1999 and working toward $0.2205 and $0.2322, a longer-horizon question also explored in Cardano's monthly price outlook.
A weaker Bitcoin tape raises the risk that ADA stalls below resistance even if the trendline structure stays intact.
This analysis does not track Bitcoin dominance figures directly and treats broader market tone only as general context, not a specific data point.
Planned Update
This Cardano price Forecast will be revisited if ADA confirms a close above $0.1999 or below $0.1807, or if no breakout confirms within 24 hours of publication, at which point the levels will be rechecked against fresh price and liquidation data.
Readers can also track an ADA retest before rally scenario separately if the pullback case plays out first.
CoinGabbar's Technical Analyst View
Bull Case: A confirmed close above $0.1999 opens the path toward $0.2205 and then $0.2322, supported by the ascending trendline structure and the heavy short-side liquidations seen over the past 24 hours.
Base Case: ADA gets rejected at $0.1999, pulls back to the trendline or $0.1807, holds there, and sets up another attempt at the same resistance zone.
Bear Case: A news-driven shock breaks the trendline entirely and closes below $0.1534, a scenario the setup treats as unlikely under normal conditions, with $0.1381 as the next level if it happens. For a broader read on where this leaves ADA, see Cardano's next move loading.
Disclaimer
This Cardano price prediction is based on technical chart analysis and market data available at the time of writing. Cryptocurrency markets are highly volatile, and prices can change rapidly. This content is for informational purposes only and should not be considered financial advice. CoinGabbar and the analyst do not hold a position . Always do your own research and consult a qualified financial advisor before making any investment


















