Dogecoin Price Prediction: DOGE Bulls Are Taking Control


So where does DOGE go from here? Our dogecoin price prediction for the near term comes down to one question:
Can it hold current support and turn higher? Get buyers stepping in and pushing through resistance above, and there's real room to climb.
Lose that support instead, and the path of least resistance is lower, at least until a fresh bottom forms and buyers get another shot.
Live DOGE Price Data
DOGE is sitting around $0.06974 right now, down 0.6% on the day after bouncing between $0.06968 and $0.07133.
Market cap: $10.834B. The fully diluted valuation comes in at $11.929B, with 155.334B $DOGE circulating out of a 171.046B total supply, and there's no max supply cap to worry about here. 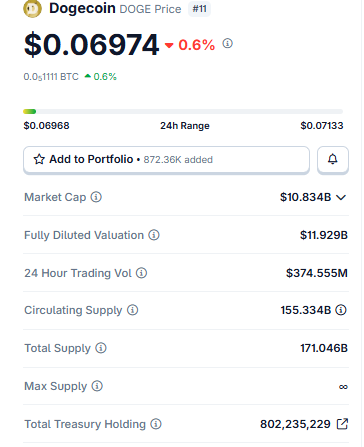
Source: $DOGE Market Cap Data Taken From Coingecko, data as of Aug 03, 2026. Figures may vary slightly across other tracking websites.
Trading volume over the last 24 hours reached $374.555M, which isn't spectacular, but it's enough to keep this forecast grounded in real activity rather than a handful of thin trades pushing the candle around.
Worth noting too: on-chain treasury holdings sit above 802 million $DOGE, a quiet detail that matters more for long-term supply watchers than for this week's price swing.
Exchange Volume and Liquidation Snapshot
Volume tells its own story here. Binance leads at $223.03M, OKX follows at $147.71M, and Bybit, MEXC, Gate, and Bitget fill out the next tier. 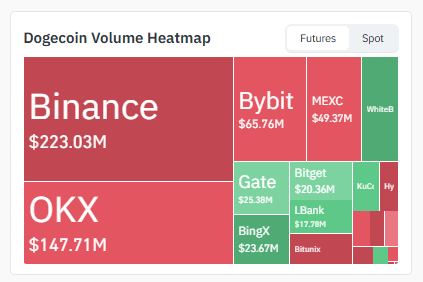
Source: Volume Heatmap Data Taken From Coinglass on 03.08.2026
That concentration on just a couple of major venues matters: a large order on Binance or OKX can move the candle more than you'd expect elsewhere.
Derivatives paint an interesting picture too. 24-hour liquidations hit $671.48K total, and shorts took the bigger beating at $517.40K against $154.08K in longs. 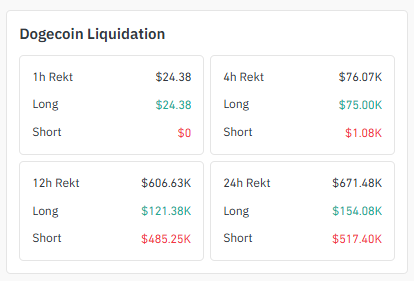
Source: Liquidation Data Taken From Coinglass 03.08.2026
Zoom into the 12-hour window, and it's the same pattern: $485.25K in short liquidations versus $121.38K in longs, which tells you $DOGE has had some sharp upward flushes even while the broader trend stays heavy.
Dogecoin News Today
One trader put it in blunt terms recently: $DOGE looks like an asymmetric bet after bleeding slowly lower since its peak near 48 cents early last year. His take? 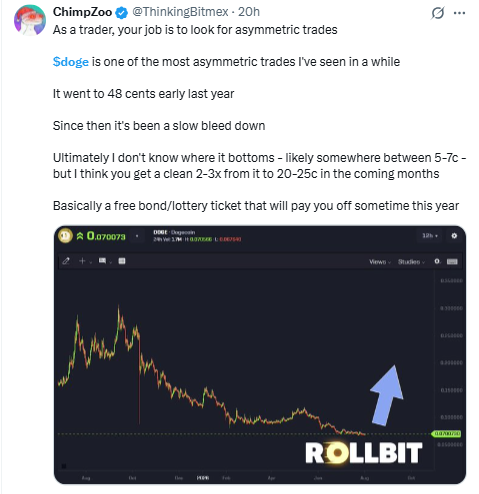
Source: Data Taken From @ThinkingBitmex, X Account.
The bottom probably sits somewhere in the mid-single-digit cent range, with room for a multi-fold move higher over the coming months once that floor actually holds.
It's a longer-range framing, sure, and it won't change what happens on this week's chart.
But it does explain why traders keep such a close eye on these support levels. Everyone's waiting for the same floor to confirm itself.
Key Takeaways
$DOGE is holding near $0.06974 right now, down 0.6% on the day and parked almost exactly at the first support inside its daily descending channel.
Bounce here, break above the channel's upper boundary, and $0.07529 comes into view, with $0.07942 not far behind.
No bounce, and support cracks instead? The daily Wolfe Wave structure points to one more leg down toward $0.06426.
Over on the 4H chart, DOGE is knocking on a falling trendline near $0.06985. A volume breakout there opens the door to $0.07204 and $0.07357.
Liquidations over the last 24 hours added up to $671.48K, and shorts took the worse end of it at $517.40K against just $154.08K in longs.
4H Chart Technical Analysis
Zooming into the 4H chart, DOGE is pressing right up against a falling trendline near $0.06985, having already climbed off a sharper wick low earlier in the session. 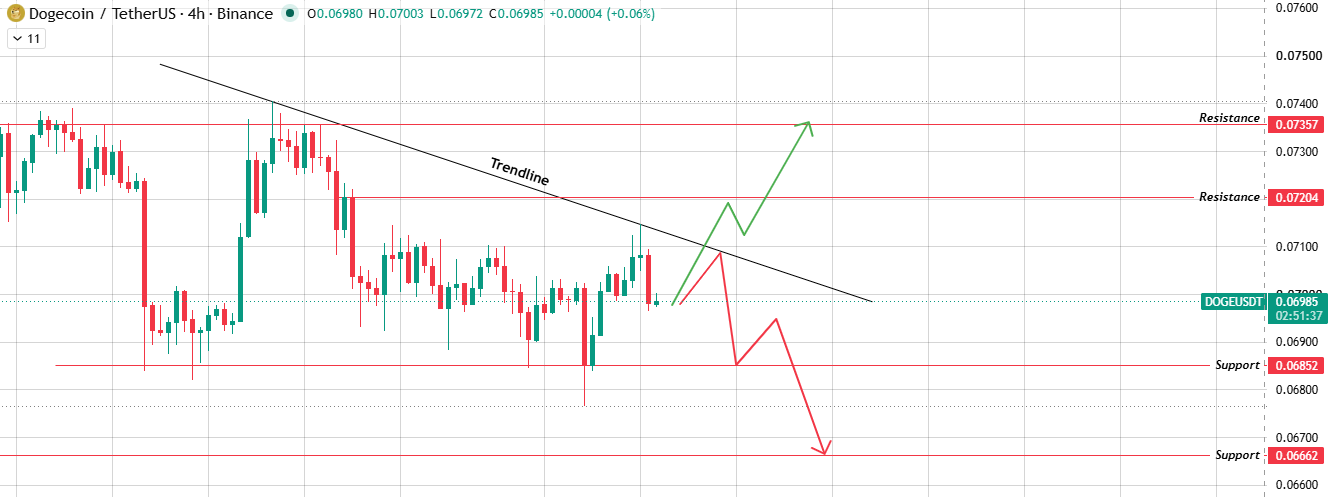
Source: Chart Taken From TradingView.
Get a volume-backed breakout above that trendline, and the path opens toward $0.07204, then $0.07357.
Get rejected instead, and that tells you sellers are still very much in the game, with a pullback toward $0.06852 and maybe $0.06662 the likely result.
Daily Chart Technical Analysis
$DOGE has spent weeks grinding lower inside a descending channel on the daily chart.
Look closely and you'll spot a five-point structure resembling a Wolfe Wave tracing out each swing along the way. 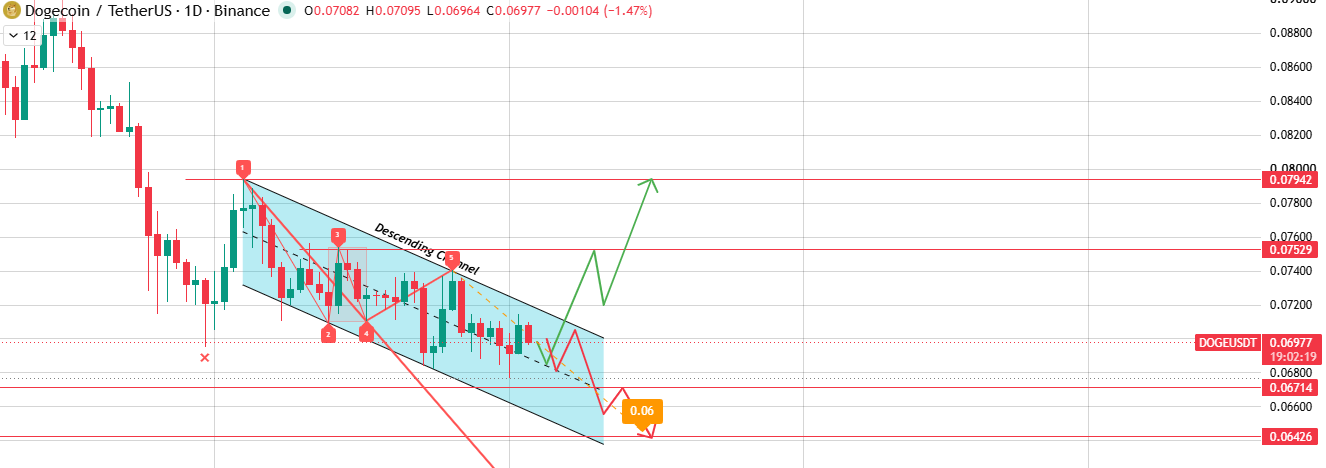
Source: Chart Taken From TradingView.
Right now the price is knocking on the first support near $0.06714, sitting almost exactly at the channel's lower boundary. Two roads from here, really.
Bounce off this support, break the channel's upper trendline, and the next stops are $0.07529 and $0.07942.
But if that bounce doesn't materialize, if this support cracks, the Wolfe Wave structure suggests one more leg down toward $0.06426. Sellers keep the wheel until that zone gets tested.
The interesting part? This shorter-term picture lines up almost exactly with the daily channel.
Same fight, really, just playing out on a smaller clock, which is why the two timeframes should be read together rather than treated as separate signals.
Bull vs Bear Scenarios
Bulls need three things to line up: $DOGE holds daily support, breaks the descending channel's upper boundary, and clears the 4H trendline on real volume.
Pull that off and $0.07204, $0.07357, and eventually $0.07529 to $0.07942 all come into play.
Bears need the opposite. Trendline rejects price, daily support at $0.06714 gives way, and DOGE slides toward $0.06662 on the 4H chart and $0.06426 on the daily.
This dogecoin price prediction keeps both scenarios on the table until a confirmed close outside the channel settles things, so don't jump the gun on a single wick.
Methodology: This forecast is based on technical analysis of TradingView 4H and daily charts, current market data, exchange volume distribution, and liquidation data. It does not constitute financial advice.
Glossary
Descending Channel: Picture two parallel lines sloping downward, boxing price in between. That's the channel DOGE has been stuck grinding through.
Wolfe Wave: A five-point swing pattern traders watch for because it often flags where a trend is running out of steam.
Trendline: Simply a line drawn across price highs or lows to map out where a trend is headed and where it might break.
Liquidation: What happens when a leveraged trade gets closed out by force because losses ate through the available margin.
Support Zone: A price area where buyers have shown up before and pushed things back up, so traders watch it for a repeat.
Disclaimer: This content is for informational purposes only and should not be treated as financial advice. Cryptocurrency markets, including Dogecoin, are highly volatile and carry significant risk of loss. Always do your own research and consult a licensed financial advisor before making investment decisions


















