Dogecoin Price Prediction: One Breakout Could Change Everything


Dogecoin doesn't need a reason to move, but today it's got one anyway.
Sitting at $0.07346, up 2.3% on the day, this Dogecoin price prediction starts with something that already happened rather than something that might.
Price has already pushed above the tight range it was stuck in on the shorter-term chart. The question now isn't whether it broke; it's whether it holds. s.
Current Price Snapshot
$0.07346, up 2.3% over 24 hours, ranging between $0.07152 and $0.07349 in that window. 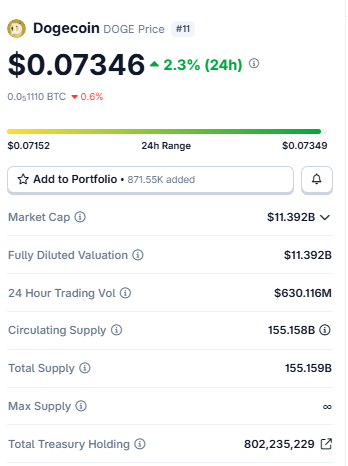
Source: Data From CoinGecko.
Market cap comes out to $11.392B, and since DOGE's supply is uncapped and the circulating figure already sits at 155.158B against a total supply of 155.159B, the fully diluted valuation lands at the exact same $11.392B.
Volume over the past day hit $630.116M, and the project-linked treasury is holding 802,235,229 DOGE.
Liquidation Heatmap: Shorts Are Taking the Bigger Hit
Rough stretch for DOGE bears. The liquidation heatmap shows $788.98K wiped out over the past 24 hours, split $372.48K.
Short against $416.49K long, actually fairly balanced on the 24h read, but zoom into the shorter windows and shorts, and they are clearly getting squeezed harder relative to size: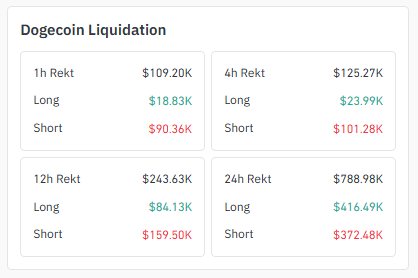
| Timeframe | Total Liquidations | Shorts | Longs |
|---|---|---|---|
| 1h | $109.20K | $90.36K | $18.83K |
| 4h | $125.27K | $101.28K | $23.99K |
| 12h | $243.63K | $159.50K | $84.13K |
| 24h | $788.98K | $372.48K | $416.49K |
That 1h and 4h skew lines up exactly with the triangle breakout, shorts got caught leaning the wrong way right as price punched through resistance, and the squeeze that followed is visible in the numbers.
Exchange Volume Heatmap
Binance is doing the heavy lifting again, with $353.77M in futures exchange volume, more than the next two combined. OKX follows at $248.56M, then Bybit at $93.56M. 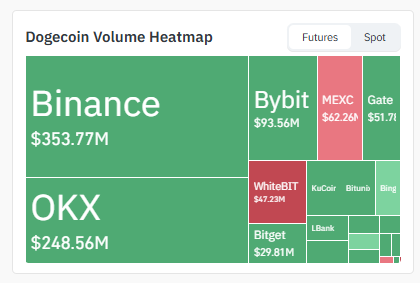
MEXC ($62.26M), Gate (~$51.7M), and WhiteBIT ($47.23M) fill the middle, with Bitget ($29.81M), KuCoin, Bitunix, LBank, and BingX picking up smaller slices.
Same story as always with DOGE; the big two exchanges are where the real directional flow lives.
Social Sentiment: Weekly TD Sequential Flashes a Buy Signal
This is the headline giving bulls something to point at beyond just the chart pattern.
According to a widely shared technical read, Dogecoin's weekly TD Sequential indicator has now printed multiple consecutive buy signals, a setup that's historically rare and has, in the past, preceded larger bull moves.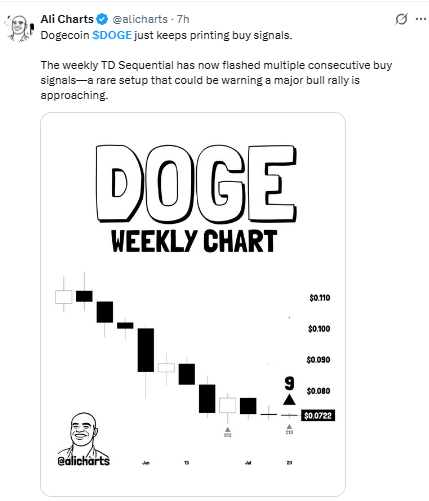
Source: According to Ali Charts on X.
Combine that with the fact that the 4H triangle has already broken out, and there's now both a short-term technical trigger and a longer-term momentum signal pointing the same direction.
Doesn't guarantee anything, but it's the kind of confluence that tends to get attention
4H Chart: The Breakout Already Happened
Here's the thing about this one: it's not a "watch for the breakout" setup anymore.
Price has already punched out of the symmetrical triangle that had been squeezing it for weeks, and it's holding just above the old triangle boundary near $0.0735 right now.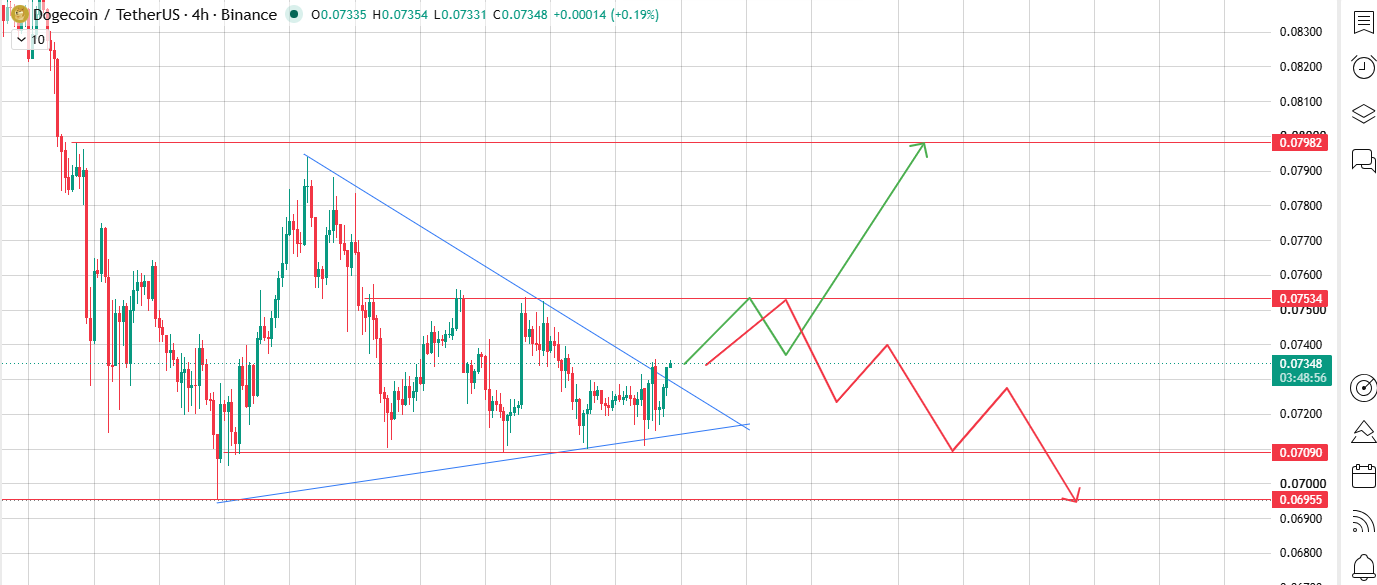
Source: Chart Taken From TradingView
If the price sustains here, the next stop is the resistance level at $0.0753, and a push through that opens the door to $0.0798.
That's the bullish path: breakout confirmed, momentum carries through.
But breakouts fail too, and if DOGE can't hold above the triangle line, the fallback is a slide back to the support zone at $0.0709, with a deeper floor near $0.0696 if sellers step back in.
Basically, the triangle did its job; now it's a question of whether buyers can defend the reclaim.
1D Chart: Fighting the Descending Channel's Upper Line
Switch to the daily , and the picture is a step behind the 4H. DOGE has been stuck inside a descending channel since the last major top, and right now the price is testing the upper trendline of that channel for the first time in a while. Two ways this goes. 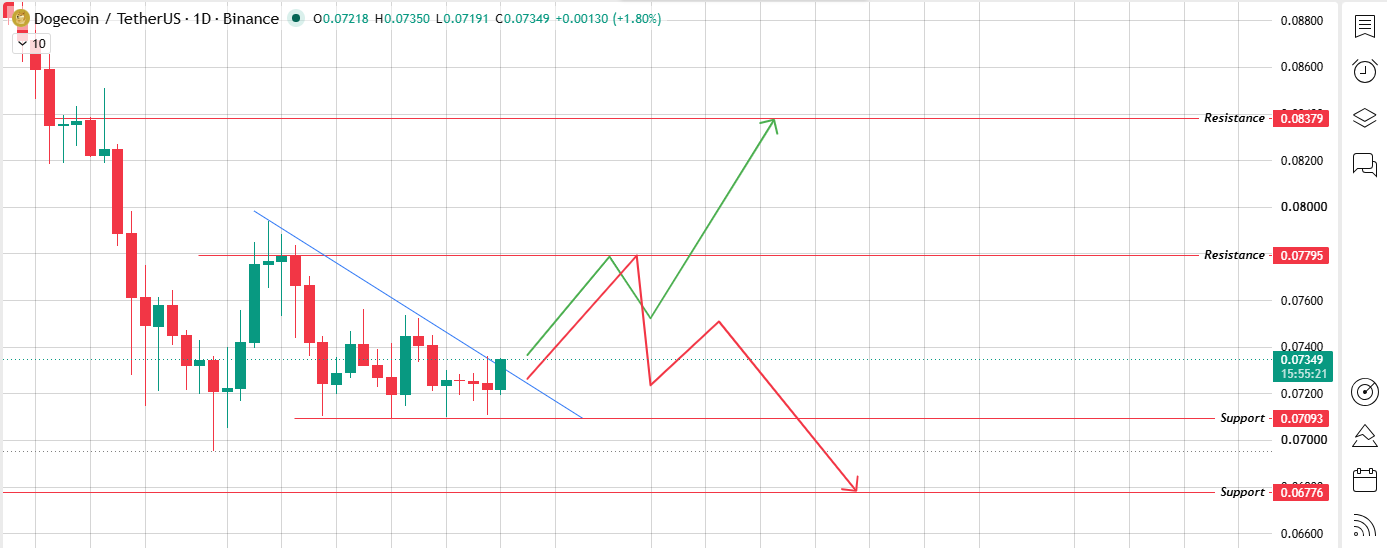
Source: Chart Taken From TradingView
Clear the trendline with a real close above it, and the next targets are $0.07795 and $0.08379, both marked as resistance on the daily.
That would put the daily chart in agreement with what's already happened on the 4H.
Fail to clear it, and the channel just keeps doing what it's been doing, dragging the price back down toward $0.07093 first, then $0.06776 if the rejection is sharp.
Simple way to think about it: the 4H already broke out, and the daily is asking whether that breakout has enough legs to flip the bigger trend too.
Three-Scenario Price Outlook (Next 7-10 Days)
| Scenario | Trigger | Price Target | Probability Read |
|---|---|---|---|
| Bearish | 4H fails to hold the triangle breakout, with the daily chart rejected at the descending channel trendline. | $0.0709 $0.0678 | Failed breakout, channel resumes control. |
| Base Case | 4H holds above $0.0735, while the daily chart continues testing the trendline. | $0.0720 – $0.0753 | Confirmation phase: the market is waiting on the daily close. |
| Bullish | Daily closes above the descending channel trendline, confirming the 4H breakout. | $0.0780 $0.0838 | Both timeframes align; the TD Sequential buy signal adds weight. |
Quick gut check on that bullish price target: $0.0838 against the current 155.158B circulating supply works out to roughly a $13B market cap.
DOGE's fully diluted valuation is already sitting at $11.392B, and supply barely changes month to month at this point, so that number isn't asking for anything unrealistic.
How DOGE Stacks Up Against Peers
| Token | 24h Change | Market Cap | 24h Liquidations | Current Setup |
|---|---|---|---|---|
| DOGE | +2.3% | $11.392B | $788.98K | Triangle breakout on 4H, testing channel trendline on 1D |
| SHIB | Mixed | Mid-cap meme | Moderate | Range-bound, tracking DOGE's lead |
| FLOKI | Mixed | Small-cap meme | Moderate | Higher beta amplifies DOGE moves |
DOGE tends to set the tone for the broader meme sector, so a confirmed daily breakout here would likely drag SHIB and FLOKI along with it; they usually move with more volatility than DOGE itself once the leader confirms a direction.
BTC and ETH Correlation
None of this happens in isolation. DOGE's breakout attempt is unfolding against the backdrop of broader BTC dominance trends, and like most large-cap alts, it still carries a meaningful ETH correlation alongside its own meme-driven flows.
Majors holding firm gives this breakout room to actually play out; a risk-off swing in Bitcoin or Ethereum would make the daily's descending channel a lot harder to escape.
Final Outlook
DOGE's setup right now has two layers working at once. The 4H has already delivered its bullish breakout out of the symmetrical triangle, and the question is purely whether it holds above $0.0735.
The bigger prize sits on the daily, where price is leaning against the descending channel's upper trendline for the first time in weeks.
Clear that with a confirmed close and $0.0780 to $0.0838 comes into view, backed by a weekly TD Sequential buy signal that's rarely wrong about timing even when it's wrong about magnitude.
Fail on either front, and a bearish breakdown sends price back to $0.0709, down to $0.0678, instead.
Glossary
Quick definitions, in case any of these terms tripped you up above.
-
Symmetrical Triangle: price gets squeezed between a falling line of lower highs and a rising line of higher lows, basically a coil that has to spring loose eventually.
-
Descending Channel: two parallel, downward-sloping lines boxing price in, the kind of structure that usually keeps grinding lower until it doesn't.
-
TD Sequential: a counting indicator traders use to spot when a trend may be exhausted; a string of consecutive buy signals suggests sellers are running out of steam.
-
Liquidation Heatmap: a snapshot of forced closeouts across exchanges, handy for spotting whether shorts or longs are getting hit harder.
-
Fully Diluted Valuation (FDV): what the market cap would look like if every last token, including ones not yet circulating, were already out there.
Methodology
Price levels, chart patterns, and technical structures referenced in this article are drawn directly from TradingView daily and 4-hour chart data for DOGE/USDT on Binance.
Liquidation and exchange volume figures are sourced from Coinglass derivatives data.
Social sentiment context is drawn from verified public statements on X. This article is for informational purposes only and does not constitute financial advice.
Disclaimer: This article is for informational and educational purposes only and should not be considered financial, investment, or trading advice. Cryptocurrency markets are highly volatile, and prices can change rapidly. Always do your own research and consult a qualified financial advisor before making any investment decisions. Past performance does not guarantee future results.

















