Floki Price Prediction: Is This FLOKI's Bounce Zone or Breakdown Risk?


Floki price prediction is sitting at a genuine fork in the road right now, with price parked right on top of the zone that decides which way this move goes next.
Floki built its early momentum on aggressive marketing and a loud community, and it has since branched out into its own ecosystem projects beyond just the token itself.
$FLOKI is currently trading at $0.0000261, down 0.9% on the day, after breaking out of a descending channel, spiking sharply higher, and then getting rejected at its 200 EMA.
Floki Live Market Data
Metric | Value |
Price | $0.0000261 |
24h Change | -0.9% |
24h Range | $0.00002574 - $0.0000265 |
24h Trading Volume | $17.167M |
Total Value Locked | $13.174M |
Max Supply | 10T |
Exchange Volume
LBank is carrying the largest share of FLOKI volume at $4.03M, ahead of MEXC at $2.09M and BingX at $1.72M.
OKX ($784.25K), Bitget ($623.05K), WhiteBIT ($543.98K), and Bitunix ($512.87K) follow next, with Gate and KuCoin contributing smaller amounts.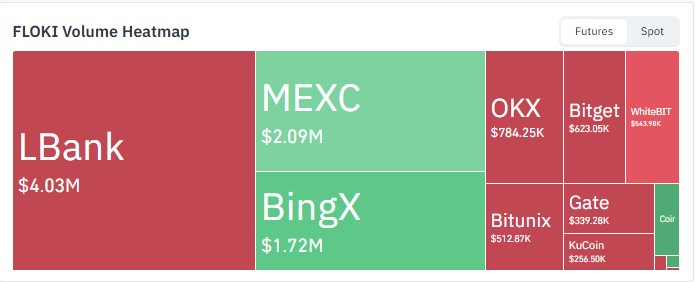
Source: Volume heatmap data taken from CoinGlass, as of Sep 07, 2026.
Floki Coin News
Trading activity around FLOKI has picked up enough to get flagged today. A crypto-focused account noted that FLOKI's 24-hour trading volume had crossed $23M, calling out the surge directly.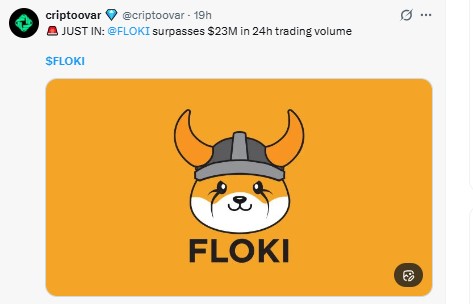
Source: Data Taken From @criptoovar, X Account.
That kind of volume spike often lines up with a chart at a decision point like this one, since traders tend to pile in around levels that could break either way.
Floki Price Prediction Outlook: Technical Analysis
The daily FLOKI/USDT chart on Binance shows the price breaking out of a descending channel it had been stuck in for weeks, followed by a sharp move higher.
That rally ran straight into the 200 EMA, got rejected, and has since pulled back to test both a fair value gap left behind during the breakout and the 21/55 EMA cluster sitting just below it.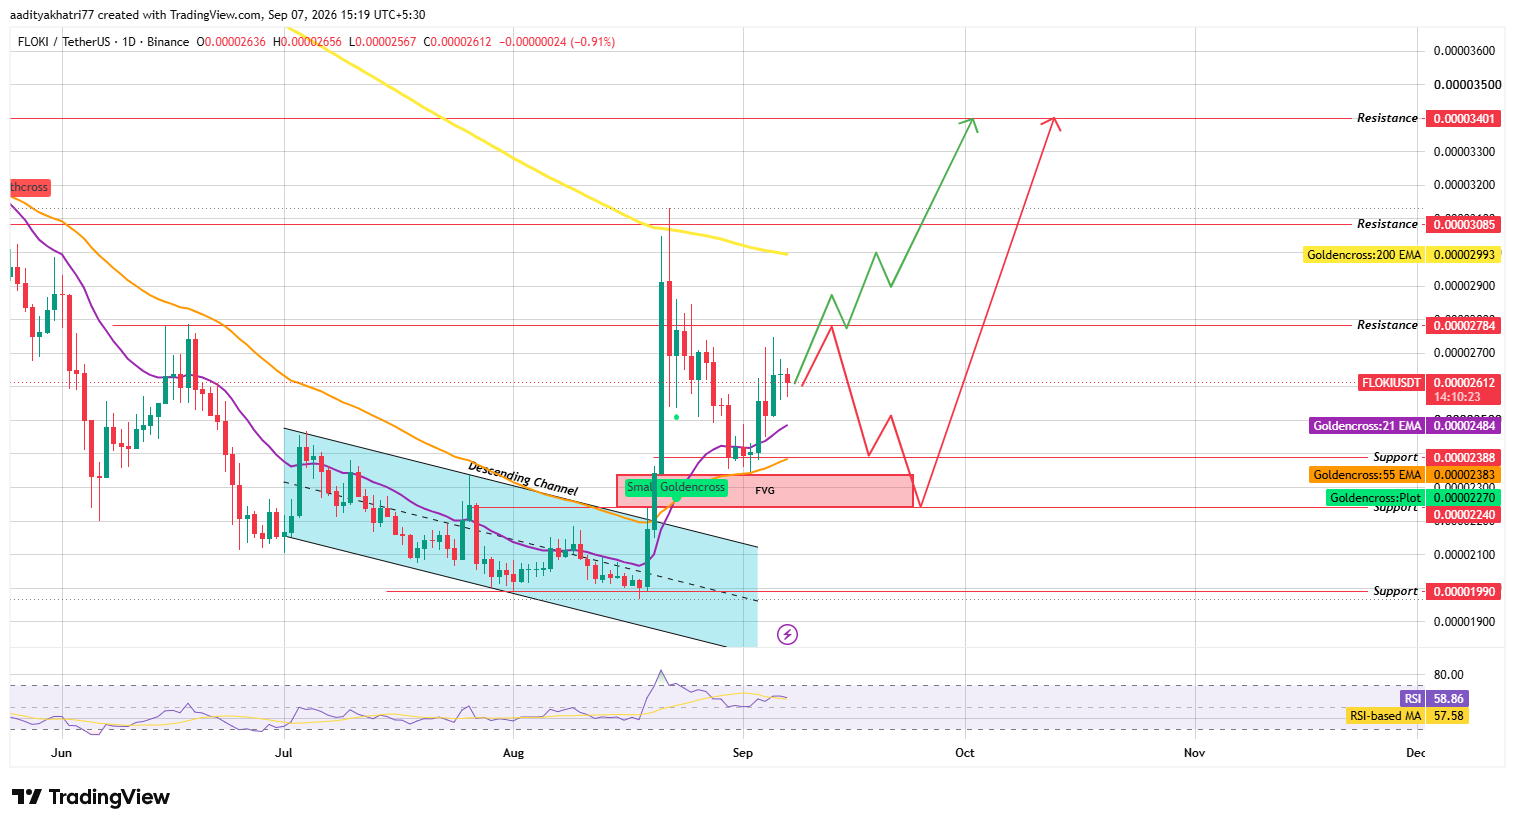
Source: Chart taken from TradingView, Binance FLOKI/USDT pair, as of Sep 07, 2026, 15:19 UTC+5:30, daily timeframe.
Can FLOKI Bounce From This Zone?
If FLOKI holds this FVG and EMA cluster with buyers stepping back in, a pushback
toward $0.00002784 becomes the first test.
Clear that on a confirmed close with volume behind it, and $0.00003085 comes into range, with $0.00003401 as the extended level if the 200 EMA finally gives way.
What Happens If FLOKI Breaks Support?
If this zone fails instead, a confirmed daily close below $0.00002388 would put the current breakout structure at risk.
Lose that, and $0.00002240 is the next support in line, with a deeper level at $0.00001990 if the pullback extends further.
RSI is at 58.86, just above its moving average of 57.58, both comfortably in bullish territory without being stretched. That reading fits a chart that's cooling off after a sharp move rather than one that's turned bearish.
Support and Resistance Levels (Daily Chart)
Level Type | Price |
Resistance 3 | $0.00003401 |
Resistance 2 | $0.00003085 |
Resistance 1 | $0.00002784 |
Support 1 | $0.00002388 |
Support 2 | $0.00002240 |
Support 3 | $0.00001990 |
EMA Levels (Daily Chart)
EMA | Price |
21 EMA | $0.00002484 |
55 EMA | $0.00002383 |
200 EMA | $0.00002993 |
Floki Price Prediction: Bull, Base, and Bear Scenarios
Scenario | Setup | Level |
Bull Case | FVG and EMA cluster hold, and resistance clears on a confirmed close with volume. | $0.00002784, then $0.00003085 |
Base Case | Price chops around the FVG zone without a clear break | Range-bound between $0.00002388 and $0.00002784 |
Bear Case | FVG and EMA support fail, confirmed close below the zone. | $0.00002240, with risk toward $0.00001990 |
Glossary
A descending channel breakout, like the one FLOKI just had, happens when price finally clears the upper trendline of a falling channel, often triggering a sharp move as short positions and sideline buyers react at once.
A fair value gap forms when a move happens too fast for the market to fully trade through a section of price, leaving a gap that often gets revisited before the next real direction takes hold, which is exactly the zone. That's playing out on FLOKI right now.
The 200 EMA tends to act as a bigger hurdle than shorter EMAs, since it reflects a much longer stretch of price history. Getting rejected there, like FLOKI just did, is common on a first attempt after a strong rally.
RSI, the same 0-to-100 momentum gauge used across these breakdowns, is currently showing a cooldown rather than a reversal, which lines up with price consolidating instead of breaking down hard.
Floki vs Bitcoin
FLOKI's current setup looks driven mostly by its own breakout and rejection sequence rather than anything specific happening with Bitcoin.
Meme coins like FLOKI do tend to amplify Bitcoin's broader mood, though, so a steady or rising Bitcoin would make it easier for buyers to defend this FVG zone, while a weak Bitcoin session would add extra pressure on an already undecided chart.
Expert Opinion
Traders watching this setup point out that a breakout followed by a 200 EMA rejection and a pullback into a fair value gap is a fairly common sequence, and how price behaves at this zone tends to say a lot about whether the breakout was genuine.
The volume spike flagged today adds some weight to whichever direction FLOKI eventually picks, since a bounce or breakdown on stronger volume tends to hold up better than one that fades quietly.
Disclaimer: This Floki price prediction is based on technical chart analysis and current market data and should not be treated as financial advice. Cryptocurrency markets are highly volatile, and actual price movements may deviate significantly from projected scenarios. Support and resistance levels discussed represent probability zones, not guaranteed outcomes, and downside risk exists at every stage of this analysis. Readers should conduct independent research before making investment decisions.
Also read:

















