Floki Price Prediction: FLOKI Eyes 40% Upside If This Holds


This Floki Price Prediction starts with the current picture: FLOKI, the meme token inspired by Elon Musk's Shiba Inu dog and built out into the broader Floki ecosystem, is currently trading around $0.00002418 today, down 0.7% over the last 24 hours, with a market cap of $233.273M.
The token has moved through multiple boom-and-bust cycles since its 2021 launch, and the current chart tells a familiar story:
$FLOKI spent weeks grinding lower before staging a sharp rally that caught traders' attention.
That rally has since cooled off, and the price is now pulling back, setting up a key moment that could decide where FLOKI heads next.
Live Market Data
Metric | Value |
Price | $0.00002418 |
24h Change | -0.7% |
24h Range | $0.00002398 – $0.00002487 |
Market Cap | $233.273M |
Fully Diluted Valuation | $483.701M |
24h Trading Volume | $17.945M |
Total Value Locked (TVL) | $11.681M |
Circulating Supply | 9.645T |
Total Supply | 9.645T |
Max Supply | 20T |
Source: $FLOKI market data taken from CoinGecko, data as of Sep 01, 2026. Figures may vary slightly across other tracking websites.
Exchange Volume
FLOKI futures volume is led by LBank at $2.71M, followed by BingX at $1.21M and MEXC at $1.10M.
OKX ($411.94K) and WhiteBIT ($386.56K) make up the next tier, with KuCoin ($299.27K), Gate ($297.54K), and Bitget ($290.32K) close behind. Bitunix ($239.31K) and CoinEx ($126.53K) round out smaller venues.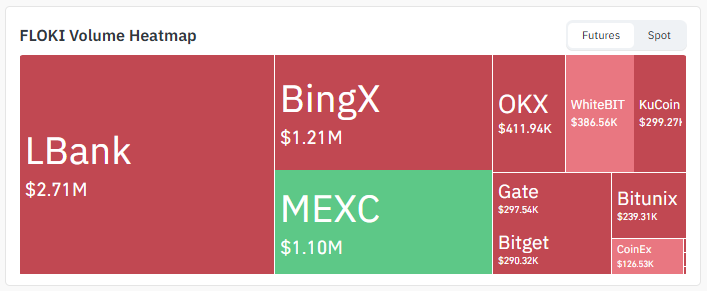
Source: Volume heatmap data taken from CoinGlass.
Volume here is comparatively thin and spread across mid-tier exchanges rather than concentrated on a single dominant venue, which can mean sharper moves on lower liquidity.
Holder Distribution
FLOKI's supply is highly concentrated. The top 100 wallets hold 90.33% of supply, and whale wallets alone, just 0.12% of all holders, control 91.26% of market cap.
The Gini distribution score sits at 0.9935, and 11 wallets each hold at least 1% of the total supply.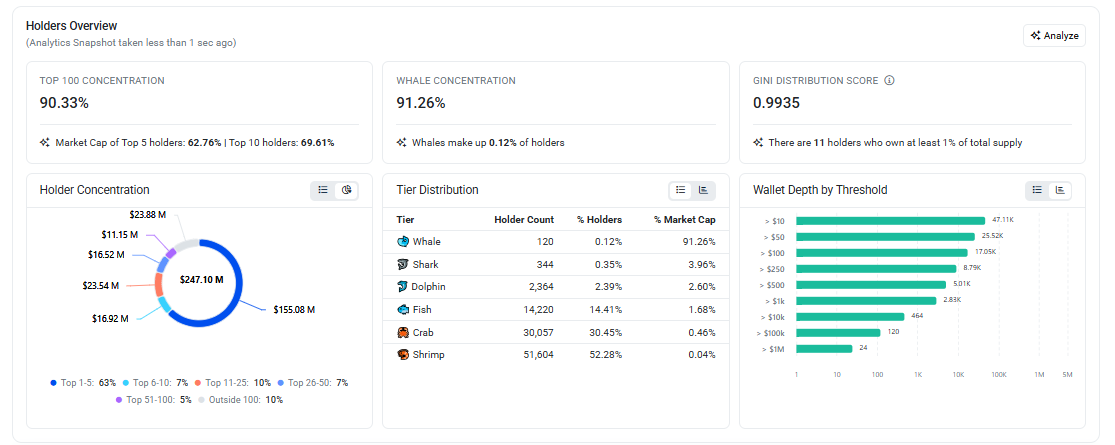
Tier | Holder Count | % of Holders | % of Market Cap |
Whale | 120 | 0.12% | 91.26% |
Shark | 344 | 0.35% | 3.96% |
Dolphin | token and | token and | 2.60% |
Fish | 14,220 | 14.41% | 1.68% |
Crab | 30,057 | 30.45% | 0.46% |
Shrimp | 51,604 | 52.28% | 0.04% |
Source: Holder distribution data taken from Etherscan.
This level of concentration means large-wallet activity can move price disproportionately versus a more evenly distributed token and is worth factoring into position sizing and risk.
Key Takeaways
$FLOKI trades near $0.00002418, down 0.7% over the past 24 hours, after breaking out of a descending channel on the daily chart.
Price rallied into resistance near $0.00002784, was rejected, and is now retracing to fill an FVG left behind during the breakout.
A bounce with volume from current support would open the path toward $0.00002784, $0.00003085, and $0.00003401.
A failed bounce would shift focus toward $0.00002094 and $0.00001967.
RSI sits at 51.85, well below its own moving average of 63.24, showing momentum has cooled since the breakout.
Whale wallets control 91.26% of market cap, a concentration level worth watching for outsized moves.
Technical Analysis
How Did FLOKI Get Here?
$FLOKI spent an extended stretch inside a descending channel on the daily chart, with both highs and lows trending lower.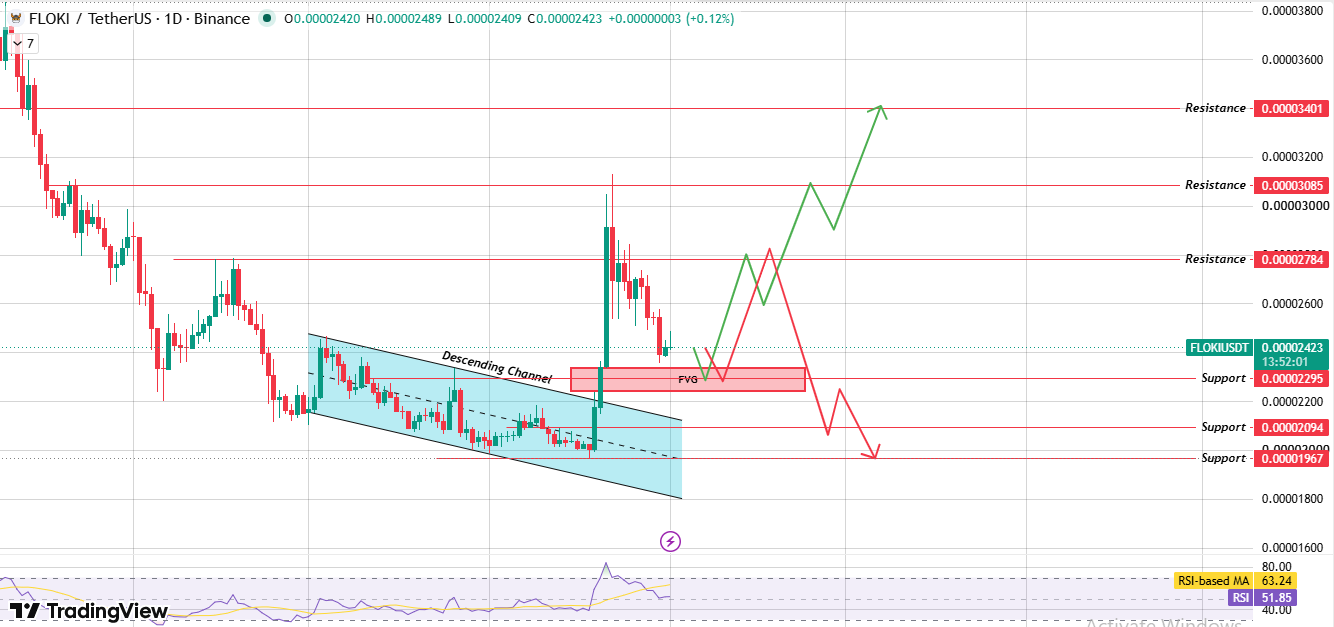
Source: Chart Taken From TradingView.
Price broke the channel's upper boundary with a sharp green candle, leaving behind a fair value gap (FVG) and pushing quickly into resistance near $0.00002784, where it was rejected.
What Pattern Is FLOKI Forming Now?
Since that rejection, FLOKI has been pulling back toward the FVG zone and the $0.00002295 support level.
This retracement is common after a fast breakout move; price often revisits the gap before deciding its next direction.
Is Momentum Still Supportive?
RSI reads 51.85 today, sitting well below its own moving average of 63.24. That gap shows momentum has faded notably since the breakout rally peaked.
The reading is roughly neutral, just above the 50 mark, so the setup is balanced rather than clearly bullish or bearish until the price shows its hand at support.
What Happens On A Bounce From Support?
If FLOKI holds the $0.00002295 support zone and bounces with rising volume, that would confirm buyers are still in control after the breakout.
That scenario points first toward $0.00002784, then $0.00003085, with $0.00003401 as the extended level.
What Happens If the Bounce Fails?
If FLOKI instead fails to hold support and closes a daily candle below the FVG zone, that would confirm the rejection at resistance has more room to play out.
The first support to watch in that case is $0.00002094, followed by $0.00001967.
Support & Resistance Levels
Type | Level |
Resistance 3 | $0.00003401 |
Resistance 2 | $0.00003085 |
Resistance 1 | $0.00002784 |
Support 1 | $0.00002295 |
Support 2 | $0.00002094 |
Support 3 | $0.00001967 |
Bull, Base & Bear Case
Scenario | Target Levels | Trigger | Invalidation |
Bull Case | $0.00002784 $0.00003085 $0.00003401 | Bounce from support with volume above the recent daily average | Daily close below $0.00002295 |
Base Case | $0.00002295 – $0.00002784 range | Price holds the FVG/support zone, oscillating below resistance | Break of either boundary on a daily close |
Bear Case | $0.00002094 $0.00001967 | Daily close below the $0.00002295 support zone | Daily close back above $0.00002784 |
Note: All levels are chart-derived from the daily FLOKI/USDT timeframe. This is not financial advice, and any bounce or breakdown signal can fail; treat these as conditional scenarios, not guarantees.
Glossary
Descending Channel: A price structure where both highs and lows trend lower inside two roughly parallel lines.
Fair Value Gap (FVG): A price range left behind by a sharp, low-liquidity move, which price sometimes revisits later.
RSI (Relative Strength Index): An oscillator ranging from 0 to 100 that measures the speed and size of recent price moves, often used to flag overbought or oversold conditions.
Whale Concentration: The share of total supply or market cap held by the largest wallets, used to gauge how easily large holders could move price.
Gini Distribution Score: A measure from 0 to 1 of how unevenly a token's supply is distributed; scores closer to 1 indicate higher concentration among fewer holders.
Methodology
Price levels and chart patterns referenced in this Floki price prediction are drawn from the FLOKI/USDT daily chart on Binance, using the most recent completed daily candle close. Liquidity, exchange volume, and holder distribution figures are sourced from
All levels reflect data at the time of writing and are subject to change as new candles form. This forecast does not extend any target beyond what the visible chart structure directly supports.
Disclaimer: This Floki Price Prediction is for informational purposes only and does not constitute financial, investment, or trading advice. FLOKI and cryptocurrency markets broadly are highly volatile, and any chart pattern discussed here, including the descending channel and FVG, can fail to play out as expected. High holder concentration can amplify volatility beyond what technical levels alone suggest. Downside risk in the bear scenario could extend beyond the stated support levels if broader market conditions turn negative. Always do your own research and consult a qualified financial advisor before making investment decisions.
Also read:
















