Dash Price Prediction: $DASH Explodes 130%+ Can It Hold Above $61?


$DASH just staged one of the sharpest moves in the market, rocketing off a months-long base and briefly touching above $72 before pulling back hard.
This Dash price prediction looks at whether the rally has legs left or whether the pullback is just getting started, and which levels will decide it.
Market data was checked on September 7, 2026, at 06:39 UTC-3.
Dash Price Prediction Today: Market Overview
Metric | Value |
Price | $67.70 |
24h Change | -1% |
Market Cap | $870.15M |
FDV | $1.28B |
24h Volume | $292.0M |
Vol/Mkt Cap (24h) | 33.9% |
Total Supply | 12.82M DASH |
Max Supply | 18.9M DASH |
Circulating Supply | 12.82M DASH |
Source: Data from CoinMarketCap as of September 7, 2026, at 06:39 UTC-3. Figures may vary slightly across other tracking websites.
Dash Liquidation and Volume Data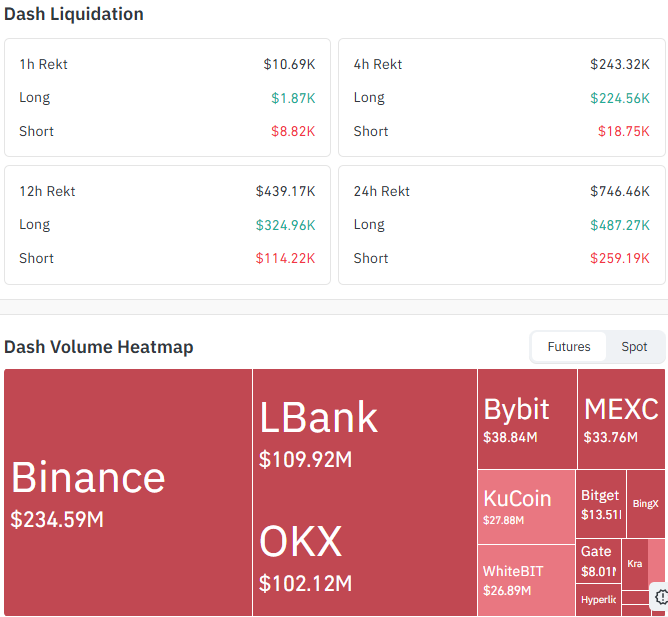
Futures data from Coinglass shows heavy activity as DASH's rally cooled off:
Timeframe | Total Liquidated | Longs | Shorts |
1h | $10.69K | $1.87K | $8.82K |
4h | $243.32K | $224.56K | $18.75K |
12h | $439.17K | $324.96K | $114.22K |
24h | $746.46K | $487.27K | $259.19K |
Longs took the bulk of the damage over 4h, 12h, and 24h, showing that traders who chased the rally near the top got caught in the pullback.
On the futures volume side, Binance leads with $234.59M, followed by LBank at $109.92M, OKX at $102.12M, Bybit at $38.84M, MEXC at $33.76M, KuCoin at $27.88M, WhiteBIT at $26.89M, Bitget at $13.51M, and Gate at $8.01M.
This futures activity is separate from DASH's CoinMarketCap spot volume figure above.
DASH Technical Analysis and $DASH Price Outlook
Pair: DASH/USDT · Market: Spot (Crypto) · Exchange: OKX · Timeframe: 1D · Source: TradingView · Timestamp: September 7, 2026, 14:20 UTC+5:30
DASH is trading at $67.70, after an explosive move off a long consolidation base that had held under $30 since May.
Price surged straight through that base and briefly touched a high of $72.39 before reversing sharply on the same day, leaving a long upper wick.
The EMA cluster sits well below the current price, with the 20 EMA at $48.59 and the 50 EMA at $40.93, both now far beneath the breakout zone and acting only as deep support.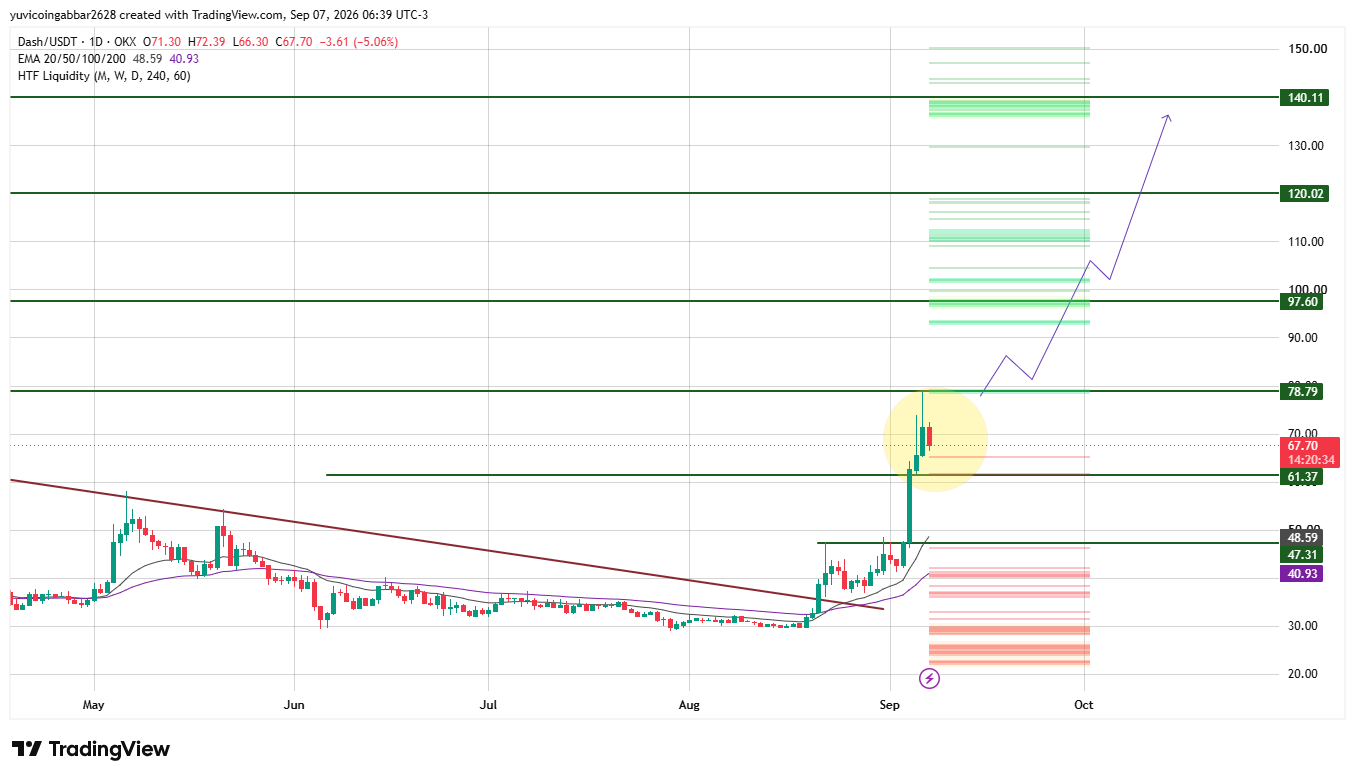
$DASH Price Forecast: Key Levels
Level Type | Price |
Resistance 4 | $140.11 |
Resistance 3 | $120.02 |
Resistance 2 | $97.60 |
Resistance 1 (nearest) | $78.79 |
Immediate Price Reference | $67.70 |
First Confirmed Support | $61.37 |
Deeper Support | $47.31 |
Dash Forecast: Bull Case vs Bear Case
Bull case: Holding above $61.37 and reclaiming $78.79 would confirm the breakout is stabilizing after the sharp pullback, opening the path toward $97.60 and eventually $120.02.
Bear case: A close back below $61.37 would suggest the rally is unwinding faster than expected. Losing $47.31 would put DASH back near its pre-breakout base and undermine the entire move.
Scenarios, Triggers, and Invalidation
Scenario | Trigger | Likely Outcome | Invalidation Point |
Breakout continuation (bullish) | Hold above $61.37 and reclaim $78.79 | Push toward $97.60 | Close below $61.37 |
Range consolidation | Chop between $61.37 and $78.79 | Sideways pause before the next leg | Break of either bound |
Deeper pullback (bearish) | Close below $61.37 | Retest of $47.31 | Reclaim above $78.79 |
Can DASH Reach $140.11?
$140.11 is the highest resistance level marked on the chart.
Getting there would require DASH to clear every level above it first, starting with $78.79, then $97.60 and $120.02, a long multi-stage climb after an already massive move that would need fresh momentum to sustain.
Dash Price Prediction 2026: Expert View
According to CoinGabbar analysts, The scale of this breakout is rare, and the heavy long liquidations show just how fast the pullback hit overextended positions. $61.37 is the level that separates a healthy cooldown from a deeper reversal of the whole move.
Disclaimer: This piece is for informational purposes only and isn't financial advice. The levels and scenarios above are based on technical chart analysis and publicly available data at the time of writing, and crypto markets can move sharply within hours, so past patterns don't guarantee future outcomes. It's worth doing independent research and considering your own risk tolerance before acting on any of the levels discussed here.
Also read:

















