Hedera Price Prediction August 2026: Can HBAR Finally Break Free?


HBAR has spent the past few weeks squeezing into a tighter and tighter range, and the chart is starting to look like it wants to make a decision.
This Hedera price prediction August 2026 looks at why the coin is stuck between a short-term triangle and a much older downtrend and what needs to happen before anyone can call this a real recovery.
Why Is HBAR Barely Moving Today?
HBAR is trading around $0.06869, down 1.13% over the past 24 hours. Market cap sits near $3 billion, while 24-hour trading volume has slipped to $22.62 million, itself down 5.55% from the previous session.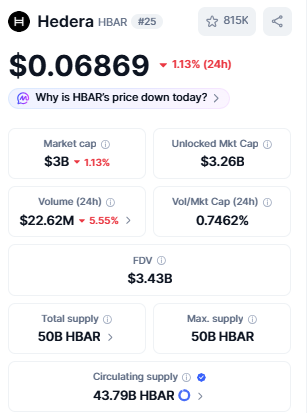
That kind of fading volume during a small decline usually points to hesitation rather than conviction.
Sellers are not pressing hard, but buyers are not stepping in with size either. The market looks like it is waiting for a reason to move.
Data source: CoinMarketCap
Hitachi, Hedera, and the Enterprise Adoption Talk
A post from ALLINCRYPTO on X has drawn attention to Hitachi's involvement with Hedera, framing it as part of the network's ongoing enterprise adoption discussion.

It is worth being clear here: this is third-party commentary, not a fresh official announcement from Hedera or Hitachi.
There is no confirmed new partnership tied to this specific post. Still, it keeps Hedera's enterprise narrative in circulation at a time when traders are looking for reasons to justify a bigger move in either direction.
What Are Futures Traders Signalling?
Open interest in HBAR futures stands near $85.95 million.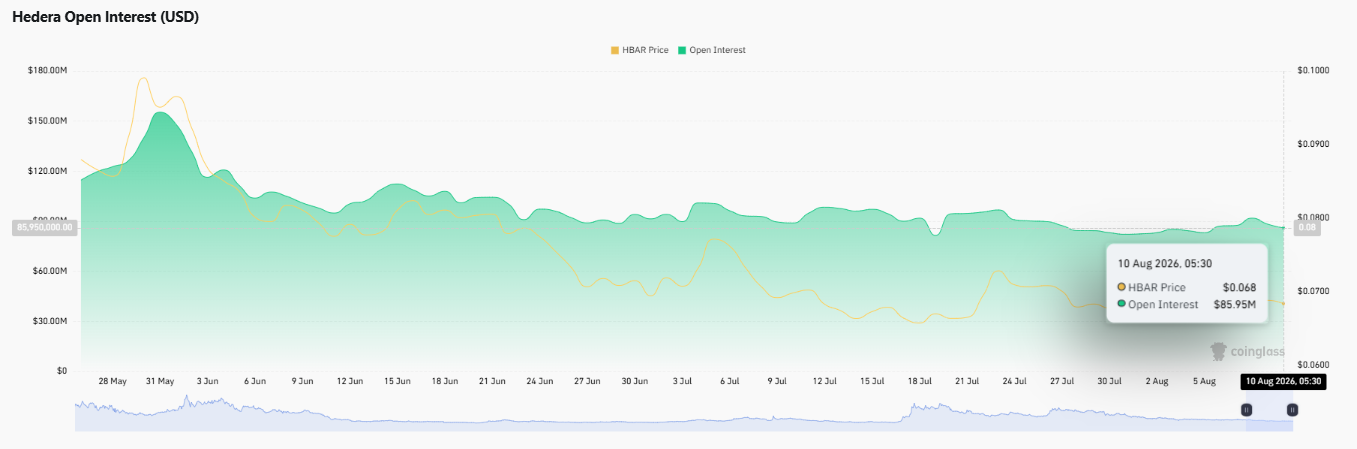
Over the last 24 hours, total liquidations reached $29.10K, split between $20.19K in long liquidations and $8.91K in short liquidations.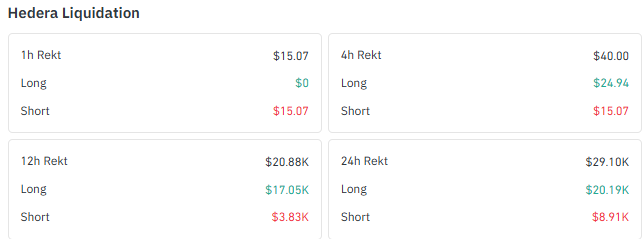
Longs have clearly taken the bigger hit during recent weakness, which is not unusual when prices grind sideways or lower.
Positioning across exchanges tells a more mixed story. Broader HBAR derivatives data from Binance shows retail-style accounts sitting slightly short, with a long/short ratio of 0.912.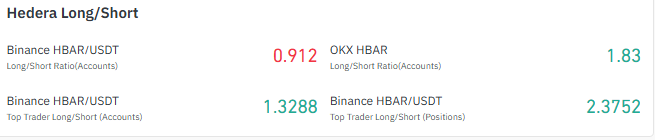
Binance's top traders lean the other way at 1.3288 by account and 2.3752 by position size. OKX accounts are also long-leaning at 1.83.
In short, the average trader is cautious, but larger, more experienced traders appear more comfortable holding long exposure to this setup. That is not proof of an incoming rally, but it is a divergence worth watching.
Data source: coinglass
The Chart Tension: Triangle Versus Channel
The TradingView 4-hour chart shows HBAR compressed inside a symmetrical triangle, with rising support meeting a descending trendline.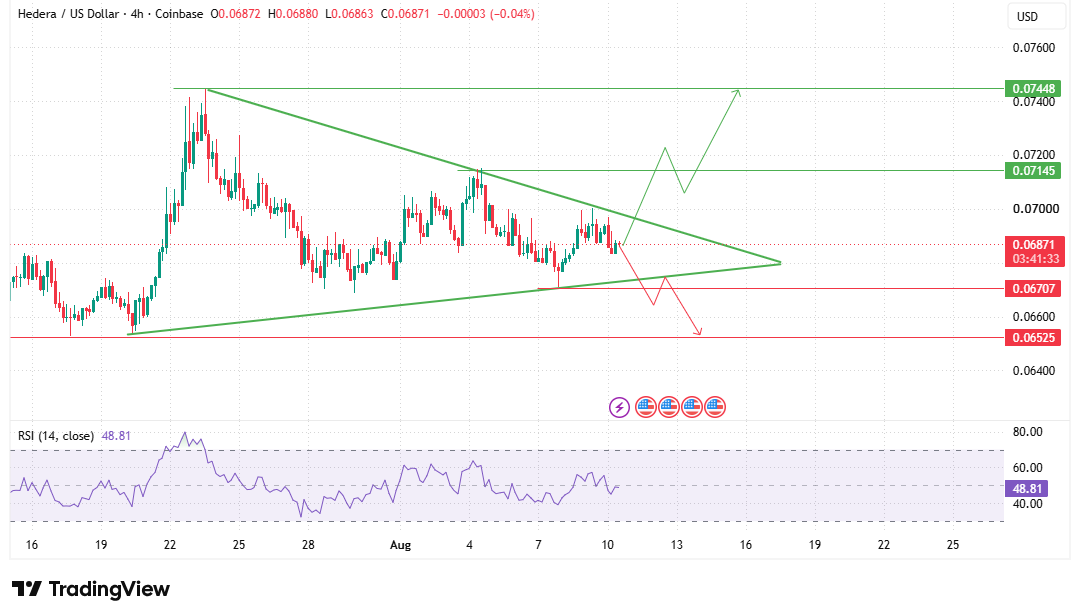
Neither side has managed to take control, and the range has been narrowing steadily.
A genuine breakout here would need to hold on a closing basis rather than just poke through the trendline intraday, and a retest of the broken edge would add more weight to the move.
Zoom out to the daily chart, and the picture is less settled. $HBAR is still operating inside a descending channel that has defined price action for months.
The current price is testing that descending trendline, but testing a level is not the same as breaking it.
Market structure on the daily remains a pattern of lower highs, and that only changes once price closes convincingly above the channel and holds there on rising volume.
Support, Resistance and RSI: The Levels That Matter
4-Hour Chart
The 4H RSI sits at 48.81, almost dead center of neutral, which fits a market waiting for its next cue.
Immediate support holds at $0.06707, with a deeper floor at $0.06525. On the upside, the first resistance to watch sits at $0.07145, followed by $0.07448.
Daily Chart
Daily RSI reads 46.36, still under the neutral 50 mark, showing momentum leans mildly weak even as price stabilizes.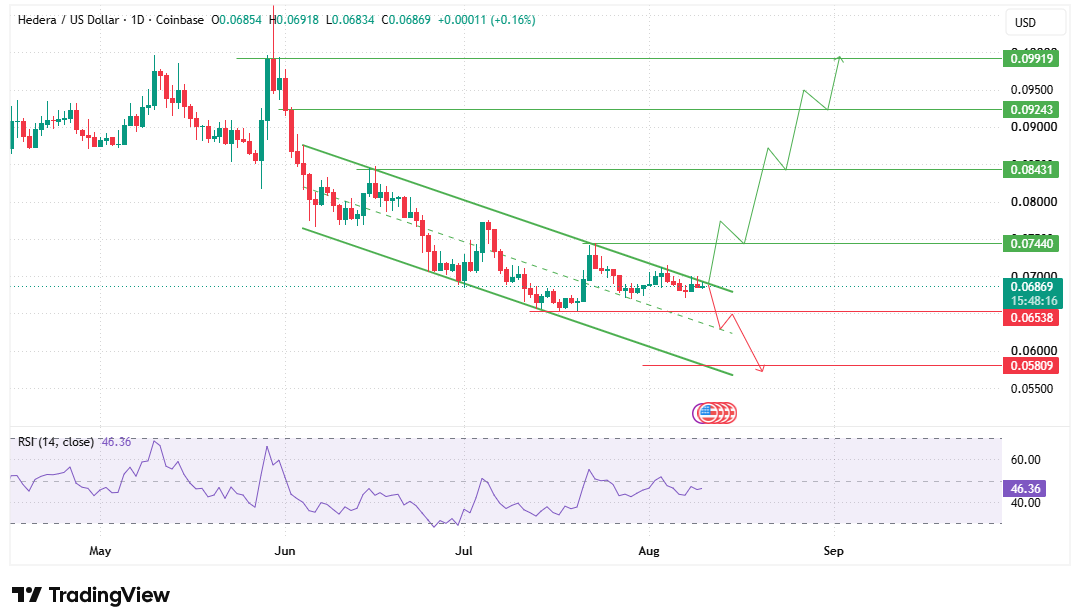
Below current levels, support holds near $0.06538, with a more significant floor at $0.05809.
Above the descending channel, the levels worth watching stretch from $0.07440 to $0.08431, then $0.09243, and finally $0.09919, a level that sits right at the edge of the psychological $0.10 zone.
Data source: TradingView
Bull, Neutral, and Bear Scenarios for August
Bull Case | A confirmed close above the 4H triangle followed by a sustained move past the daily descending channel opens the path toward $0.07145, then $0.07440-$0.07448, $0.08431, $0.09243, and $0.09919. |
Neutral Case | $HBAR keeps consolidating inside the current range as buyers and sellers wait for a clean break, with price oscillating between roughly $0.0670 and $0.0715 without a decisive move. |
Bear Case | Rejection at the descending trendline followed by a loss of $0.06707 and then $0.06538 would shift risk toward $0.05809. |
HBAR Performance Across Timeframes
HBAR's short-term action has been comparatively calm, up 0.38% over the last 4 hours despite a 1.05% dip on the day and a 1.74% pullback over the past week.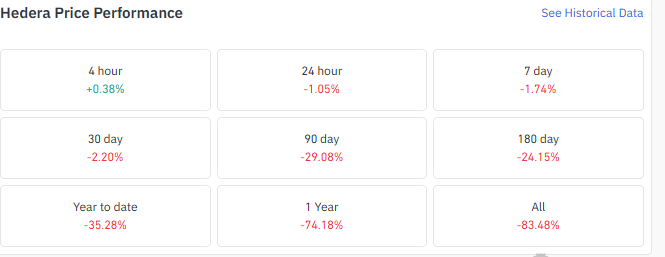
The picture gets rougher further out, with a 2.20% decline over 30 days, a steep 29.08% drop across 90 days, and a 24.15% fall over 180 days.
Year to date, HBAR is down 35.28%, and over the past year the coin has lost 74.18% of its value.
The short-term stability stands in sharp contrast to the weak medium- and long-term trend, which is exactly why a single trendline test is not enough to call this a reversal yet.
What We're Watching Next
As per the Coin Gabbar analyst, HBAR sits at a point where the near-term chart and the bigger trend are not yet telling the same story.
The 4-hour triangle shows a market genuinely undecided, while the daily descending channel still represents the larger hurdle that has not been cleared.
RSI on both timeframes sits close to or below the neutral mark rather than showing real bullish momentum.
Futures positioning adds a layer of nuance, with smaller accounts leaning cautious while larger traders on Binance and OKX lean more long.
A breakout that holds above the daily structure, backed by rising volume and a successful retest, would carry far more weight than a brief poke above resistance.
Until that confirmation shows up, the safer read is that HBAR is testing, not breaking, and the $0.06707-$0.06538 zone remains the level that decides whether this stabilization turns into something bigger.
Disclaimer: This article is for informational purposes only and should not be treated as financial or investment advice. Cryptocurrency markets are highly volatile, and prices can move sharply in either direction. Readers should conduct their own research and consult a licensed financial advisor before making any investment decisions. Past performance and technical patterns do not guarantee future results.

















