CashCat Price Prediction: $CASHCAT Bulls Eye a New All-Time High


CASHCAT is trading at $0.1613 right now, up 42.9% today.
Quick background: it launched on Robinhood Chain just days after that network went live on July 1, 2026, built around "Cash Cat," a name Robinhood's founders reportedly considered before rebranding.
The current bounce ties back to a real catalyst: Robinhood officially listed CASHCAT in its app on August 6, 2026, bringing in a fresh wave of buyers.
So this cashcat price prediction is really about a token trying to claw back after already living through one full boom-bust cycle.
Live CASHCAT Price Data
$CASHCAT is currently trading at $0.1613, up 42.9% in a day. The 24-hour range tells the story too, $0.106 all the way to $0.1665. The market cap is near $160.679 million.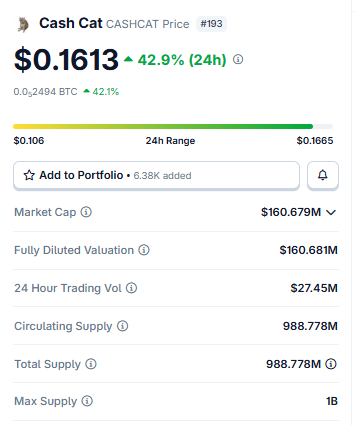
Source: $CASHCAT market cap data taken from Coingecko, data as of Aug 10, 2026. Figures may vary slightly across other tracking websites.
Fully diluted valuation barely moves the needle from that, $160.681 million, since the entire 1 billion supply is already circulating.
Daily volume landed around $27.45 million. Worth flagging for anyone reading this cashcat price prediction: no future unlocks here; the whole supply's already out.
Liquidation Data and Exchange Volume
$461.92K wiped out over the past day, and shorts took almost the entire hit, $448.06K of it, against a measly $13.86K on longs. 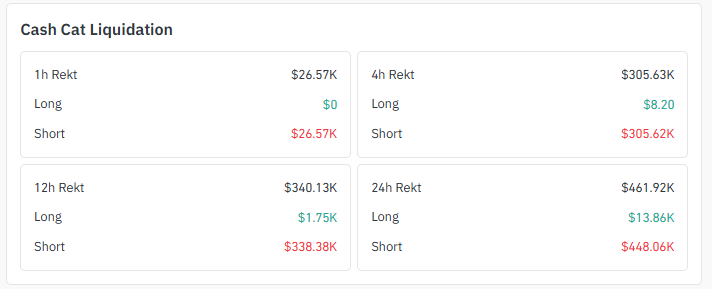
Source: Liquidation Data Taken From Coinglass .
Same story in the 12-hour and 4-hour windows, shorts absorbing most of the damage each time.
Traders betting against CASHCAT kept getting caught out as the price refused to slow down. 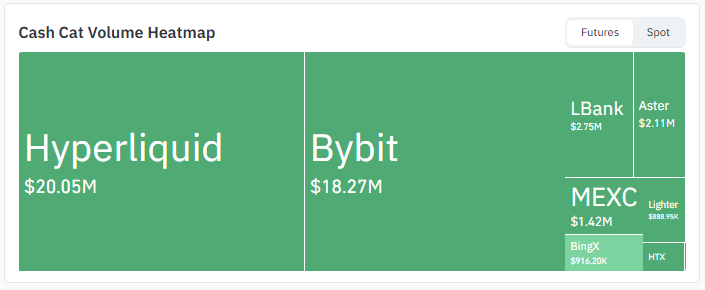
Source: Heatmap Data Taken From Coinglass.
Hyperliquid's leading volume is $20.05 million, with Bybit right behind at $18.27 million. LBank, Aster, MEXC, Lighter, and BingX split what's left.
Key Takeaways
-
Up 42.9% today, sitting near $0.1613, a proper move for a single day
-
Still stuck inside a rising channel on the 1-hour chart, hasn't broken out yet
-
Shorts, not longs, are the ones bleeding on this run
-
Hyperliquid and Bybit are carrying most of the volume between them
-
Whichever way this channel breaks will probably set the tone next
Social Sentiment of $CASHCAT
Talk around CASHCAT right now keeps circling back to the token closing in on a $140 million market cap again, with some drawing comparisons to Dogecoin's staying power rather than treating it as a one-off pump. 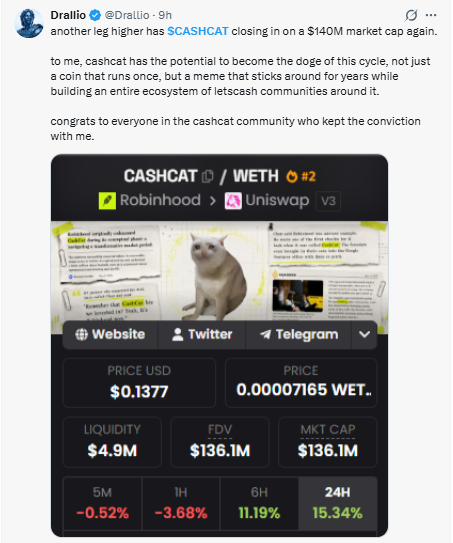
Source: Data Taken From @Drallio , X Account.
That's narrative, though, not technicals, so it's worth weighing that framing against what the chart's actually showing before leaning too hard on this cashcat price prediction.
Technical Analysis: What The Hourly Chart Is Saying
CASHCAT is boxed inside an ascending channel on the 1-hour and currently trading at $0.1618. 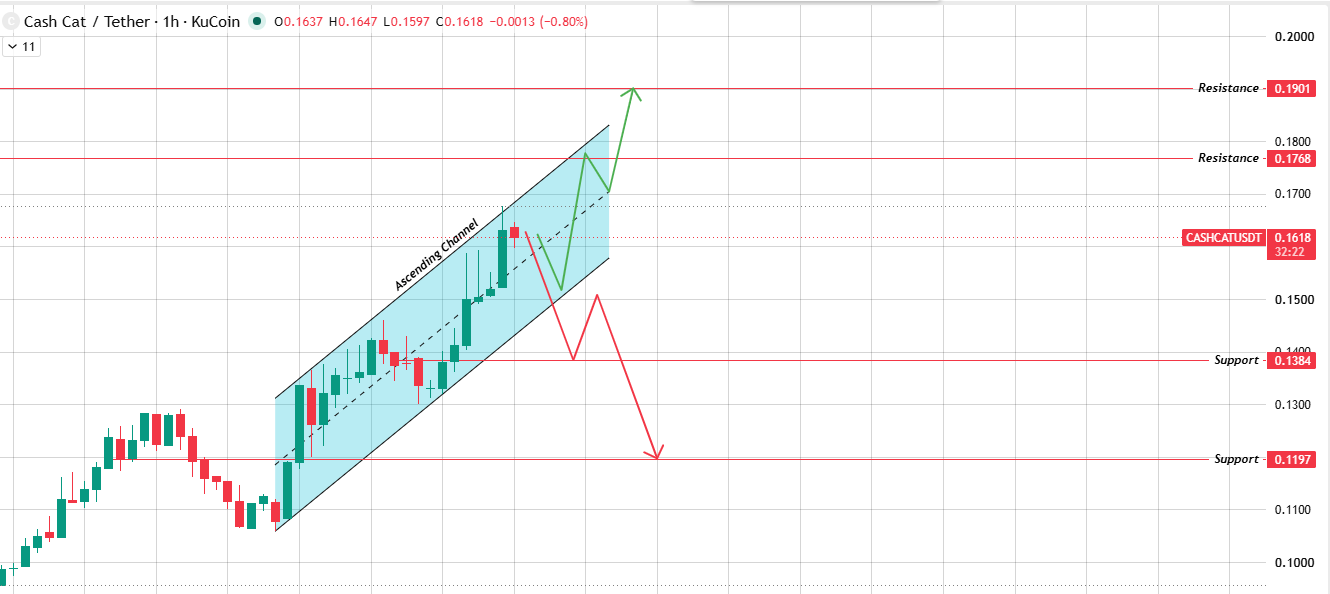
Source: Chart Taken From TradingView .
Break the upper boundary of the channel, and $0.1768 is the first resistance level; $0.1901 sits above that.
Break the bottom instead, and support levels at $0.1384, with $0.1197 further down.
Nothing's resolved yet, though; the price is still inside the channel as of writing.
Daily Chart Analysis of Cashcat
On the daily chart, $CASHCAT has reclaimed the 0.618 Fibonacci retracement level near $0.1516 and is now testing the 0.786 level around $0.1685. 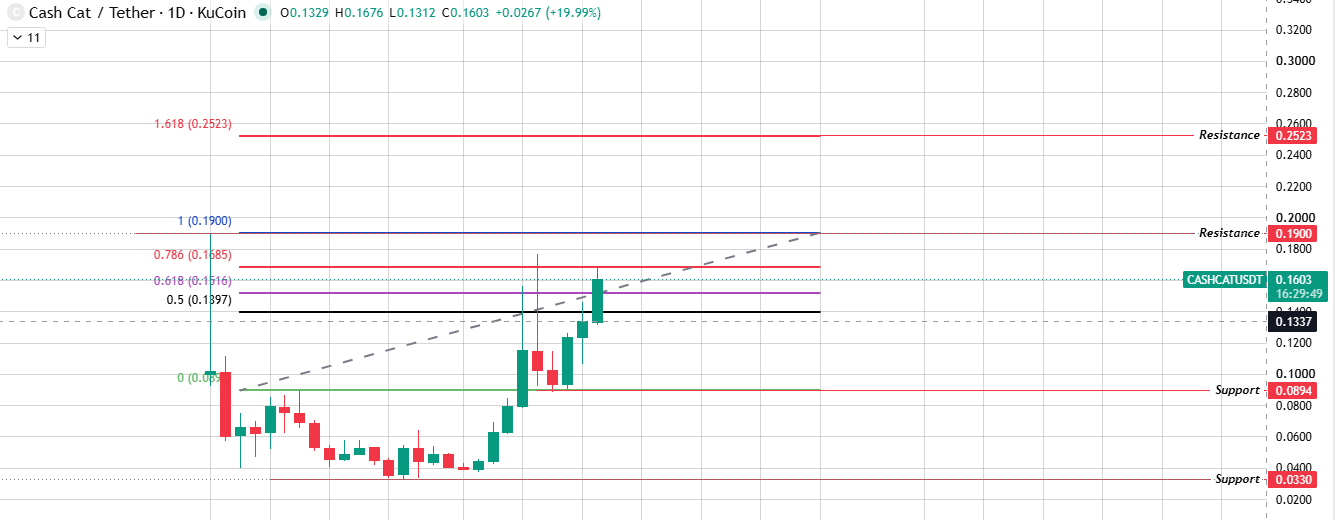
Source: Chart Taken From TradingView.
The 1.0 retracement, sitting close to $0.1900, lines up almost exactly with the token's prior all-time high zone, making it the key level to watch.
A confirmed break above $0.1900 opens room toward the 1.618 extension near $0.2523. On the downside, support sits at $0.0894, with a deeper floor at $0.0330 if that fails too.
Basically, the daily chart shows $CASHCAT is recovering steadily but still has to clear that old high before this cashcat price prediction can turn more confidently bullish.
Bull, Base, and Bear Case
Long-Term Outlook
Comes down to $0.1901, honestly. Clear it and hold, and the broader cashcat price prediction turns more bullish.
Fail there, or slip back below $0.1384, and the outlook weakens fast.
Glossary
Two parallel lines sloping upward, price bouncing between them, that's an ascending channel in plain terms.
When an exchange force-closes a trader's leveraged bet because the losses got too big to cover, that's a liquidation.
Resistance is just a price zone where selling has historically stepped in and stopped things from climbing further.
Flip that around and you get support, a zone where buying has historically shown up to stop a drop.
Disclaimer: This article is for informational purposes only and does not constitute financial advice. Cryptocurrency markets are highly volatile, and past price behavior does not guarantee future results. Always conduct independent research before making investment decisions.

















